Blog

  • 5 Ways to Improve Your Rating as a Ride-Hailing Driver

    5 Ways to Improve Your Rating as a Ride-Hailing Driver

    Maintaining a high driver rating on Uber and Lyft directly impacts earning potential, access to premium services, and job security. A rating below 4.6-4.7 triggers platform warnings, while ratings consistently below 4.0 risk account deactivation. Understanding what factors drive ratings and implementing strategic improvements enables drivers to consistently achieve 4.8+ ratings, unlocking premium income opportunities and preferred ride allocation.​

    1. Maintain Immaculate Vehicle Cleanliness and Condition

    Vehicle cleanliness represents the single most controllable factor affecting driver ratings. Research from Uber’s San Francisco analysis identified vehicle condition as one of the top reasons for low ratings, ranking alongside navigation and driving quality. Passengers expect rides to feel professional—comparable to premium services rather than basic transportation.​

    Comprehensive vehicle maintenance requires:

    Interior cleanliness: Weekly vacuuming of floor mats and seats, removal of all trash and debris, wiping down dashboards and surfaces, and cleaning windows inside and out. Drivers should maintain completely empty trunks, as passengers specifically note appreciation for uncluttered vehicles. Visible order communicates professionalism more effectively than any verbal greeting.​

    Odor elimination: This represents a non-negotiable requirement. Passengers uniformly cite unpleasant smells—lingering smoke, food odors, or mustiness—as primary reasons for low ratings. Odor control requires multiple approaches: using car air fresheners, opening windows between rides, investing in professional detailing, avoiding eating in the vehicle, and ensuring proper ventilation. Even subtle odors acceptable to drivers often register as problematic for passengers.​

    Exterior presentation: Weekly car washes maintain appearance and demonstrate pride in the vehicle. Chipped paint, dirty windows, or neglected exteriors undermine professional impression despite interior quality.​

    Comfort features: Small amenities—bottled water in cup holders, phone chargers for both iOS and Android, mints or breath mints, aux cords enabling passengers to control music—significantly impact ratings. Research shows drivers providing these comfort upgrades earn consistently higher ratings than drivers offering basic service. Investment cost remains minimal (under $100 annually) while impact on ratings is substantial.​

    The time investment is also manageable: allocating 15-20 minutes between rides for vacuuming, trash removal, and surface wiping maintains pristine conditions throughout driving shifts. Drivers maintaining this discipline achieve measurably higher ratings than those neglecting vehicle maintenance.​

    2. Demonstrate Professional Courteous Behavior and Social Awareness

    Driver attitude and professionalism rank among the top factors influencing passenger ratings. Passengers frequently rate low not due to driving quality or vehicle condition, but because of perceived rudeness, disrespect, or unprofessional behavior. Conversely, passengers who encounter genuine friendliness, respect, and professionalism often provide five-star ratings despite minor inconveniences.​

    Professional behavior implementation includes:

    Greetings and acknowledgment: Greeting every passenger upon entry with genuine warmth—”Hello! Welcome, how are you doing today?”—establishes positive tone. Introducing yourself and confirming passenger identity (“Hi, I’m [name], I’ll be your driver today”) creates personal connection despite brief interaction. This simple practice is among the most impactful rating drivers, with passengers specifically mentioning friendly greetings as reasons for five-star ratings.​

    Reading passenger preferences: Different passengers have vastly different preferences for interaction. Some passengers want conversation while others prefer quiet focus on their phones or work. Observing subtle cues—whether passengers immediately put in earbuds or phones, whether they make eye contact and smile, whether they respond enthusiastically to initial greeting—indicates whether conversation is desired. Drivers who read these signals and adapt behavior accordingly receive higher ratings than those impose identical interaction style across all passengers.​

    Respectfulness across all dimensions: Passengers expect respect toward their persons and belongings. This includes never eating in the vehicle, handling doors carefully when opening/closing, avoiding aggressive language or behavior, never attempting personal contact beyond professional courtesy, and refraining from political or controversial commentary. Even if a passenger initiates sensitive topics, professional drivers redirect conversations toward neutral ground.​

    Ending rides professionally: Thanking passengers upon departure—”Thanks so much for riding with me, have a great day”—creates positive closing impression. This simple practice significantly impacts overall rating despite occupying only seconds.​

    Critically, maintaining professionalism even when facing difficult passengers is essential. Passengers may be rude, dismissive, or demanding, but professional drivers maintain courtesy regardless. This professionalism is what distinguishes drivers achieving 4.9+ ratings from those struggling at 4.6-4.7.​

    3. Deliver Smooth, Safe, Confident Driving

    Driving quality directly impacts passenger comfort and safety perception. Aggressive acceleration, harsh braking, sharp turns, and erratic lane changes create discomfort and anxiety, resulting in low ratings despite reaching destinations safely. Conversely, smooth driving that passengers barely notice—gentle acceleration, controlled braking, smooth turns—creates relaxed comfortable atmosphere.​

    Optimal driving technique requires:

    Smooth acceleration and braking: Anticipate traffic patterns, accelerate gradually, and brake gently rather than suddenly. Many drivers brake too aggressively, creating lurching sensation that unsettles passengers. Smooth acceleration means gradual speed increases rather than hard acceleration.​

    Controlled turns: Navigate turns smoothly by reducing speed before turning rather than turning while at speed, which creates sideways force. Passengers should feel comfortable enough to relax, read, or even nap during rides.​

    Proper following distances: Maintaining adequate spacing from vehicles ahead provides buffer for smooth braking and communicates controlled, safe driving.​

    Speed awareness: While staying within speed limits, driving at appropriate speeds for traffic conditions prevents white-knuckle moments where passengers fear your speed.​

    Avoiding aggressive maneuvers: Lane weaving, cutting off other vehicles, or aggressive horn use creates unsafe perception regardless of actual safety.​

    The impact is quantifiable: drivers focusing on smooth driving consistently receive 4.8-5.0 ratings while those with aggressive driving styles receive 4.6-4.7 despite similar route times. Some 5-star drivers describe passenger feedback indicating rides so smooth they fell asleep—the ultimate indicator of comfort.​

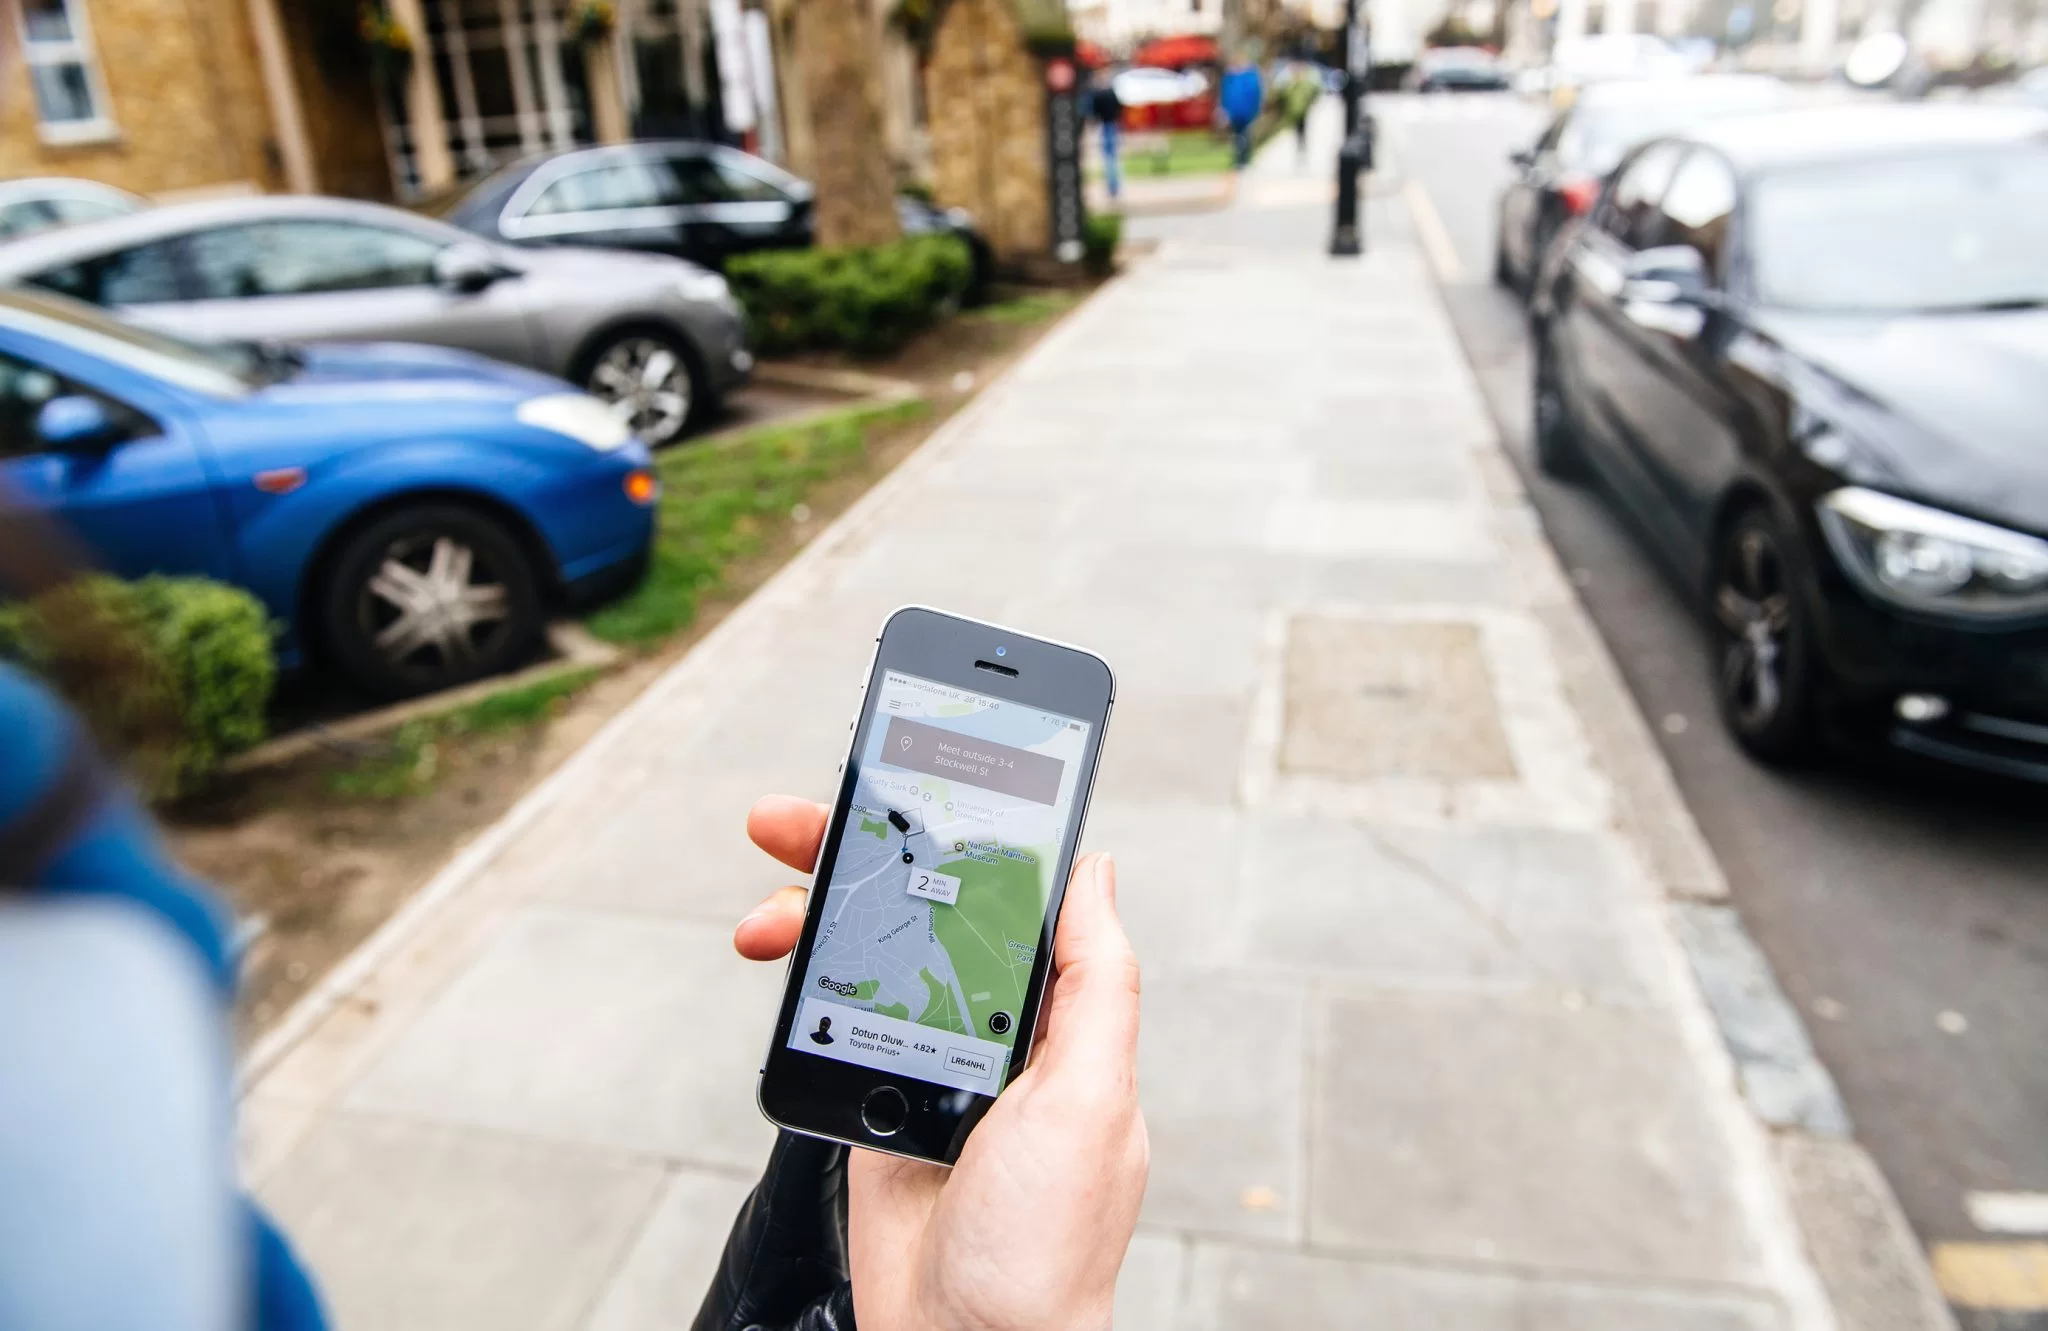
    4. Optimize Navigation and Provide Proactive Route Communication

    Navigation represents a critical rating factor. Uber’s San Francisco study identified navigation as the top reason for one-star ratings—either drivers taking inefficient routes or passengers perceiving navigation decisions as problematic. This single factor demonstrates how route selection directly impacts ratings.​

    Navigation excellence requires:

    Phone mounting: Drivers should mount phones securely at eye level, enabling glancing reference without dangerous head turns. Approximately 30-40% of Uber drivers lack proper phone mounts, driving with phones in hand or requiring frequent glances at phone positions—behavior passengers perceive as unsafe.​

    Route confirmation before pickup: At pickup, ask passengers if they have a preferred route or whether they’re comfortable with the GPS-suggested route. This simple question demonstrates passenger-centered approach and prevents later complaints about route selection.​

    Navigation familiarity: Study your service area—learn major routes, shortcuts, and traffic patterns enabling confident navigation. Drivers familiar with their market can often select routes faster and more efficiently than GPS suggestions, communicating confidence to passengers.​

    Waze utilization: While Uber’s navigation is adequate, many drivers prefer Waze for real-time traffic data and crowd-sourced incident reporting. Waze enables more accurate ETA predictions and traffic avoidance.​

    Limiting navigation distraction: Once familiar with an upcoming turn, don’t stare at the map—rely on memory to avoid looking at phone excessively. Passengers perceive excessive phone-checking as unsafe and potentially reckless.​

    Drivers implementing navigation best practices—proper mounting, route confirmation, and familiarity—consistently achieve higher ratings than those struggling with navigation.​

    5. Deliver Punctuality and Minimize Wait Time

    Passengers expect timely pickup and efficient service. Even brief wait periods (2-3 minutes) can trigger low ratings if passengers perceive negligence. Conversely, arriving quickly and getting passengers on the way rapidly creates positive first impressions.​

    Punctuality excellence requires:

    Rapid response: Upon accepting rides, navigate immediately toward pickup location. Passengers become frustrated with drivers who accept then delay. Drivers should minimize time between passenger acceptance and pickup to under 5 minutes.​

    Efficient route to pickup: Use navigation to reach pickups via most direct routes. Passengers track driver location via app and become frustrated if routes seem inefficient or circuitous.​

    Proactive communication: If running late for any reason, message passenger immediately explaining delay and estimated revised time. This transparency prevents frustration and maintains trust. A message “Hi! Running about 2 minutes late due to traffic, I’ll be there at 3:47” transforms potential complaint into understanding.​

    Completion efficiency: Once passengers board, minimize non-driving time. Get moving quickly, follow efficient routes, and avoid unnecessary conversation that delays arrival.​

    On-time arrival: Punctuality at both pickup and destination matters. Passengers planning activities or meetings depend on reliable ETAs. Drivers who consistently deliver realistic ETAs and arrive on time build reputation for reliability.​

    The cumulative impact of punctuality is substantial: drivers who consistently achieve rapid pickup and efficient service reach 4.8-5.0 rating ranges, while slower drivers languish at 4.6-4.7.​

    Additional Critical Factors: Acceptance and Cancellation Rates

    Beyond passenger-facing behavior, acceptance and cancellation rates significantly impact earning potential and platform status. Uber recently changed these metrics from 30-day rolling averages to last-100-requests windows, enabling faster improvement.​

    Acceptance rate measures what percentage of exclusive ride requests you accept. Declining requests can exclude you from Uber Pro status, which provides increased earnings, priority matching, and customer support. Maintaining 90%+ acceptance rates requires strategic ride selection—accepting rides that align with your goals rather than declining based on minor inconveniences.​

    Cancellation rate measures what percentage of accepted rides you cancel. Cancelling after accepting dramatically impacts ratings and status eligibility. Drivers should carefully evaluate rides before accepting, then commit to completing accepted rides unless circumstances make completion impossible.​

    Drivers managing both metrics maintain access to premium earnings while casual cancellers find themselves with lower pay and reduced access to desirable rides.​

    Rating Calculation and Protective Mechanisms

    Understanding rating mechanics enables strategic improvement. Lyft ratings average your last 100 rides, with the lowest score excluded. Uber ratings average your last 500 rides. Both platforms exclude certain ratings—particularly traffic-related complaints—from affecting your overall average.​

    This means low ratings for reasons outside your control (severe traffic, passenger intoxication, or unreasonable expectations) may be filtered automatically. However, ratings for cleanliness, professionalism, or driving quality are typically applied to your average.​

    The Path to Excellence

    Consistently achieving 4.9+ ratings requires attention across all five dimensions: meticulous vehicle maintenance, professional courteous behavior, smooth careful driving, optimal navigation, and punctual efficient service. Drivers excelling in all five areas don’t just maintain high ratings—they unlock premium earning opportunities, preferred ride matching, and job security. Conversely, drivers neglecting even one dimension limit their earning potential and risk account deactivation. The most successful drivers treat these practices not as optional enhancements but as essential professional standards defining sustainable driving careers.

  • How Urban Infrastructure Affects Last-Mile Delivery Times

    How Urban Infrastructure Affects Last-Mile Delivery Times

    Urban infrastructure represents one of the most significant yet underestimated factors determining delivery speed and efficiency. The quality of roads, availability of parking, density patterns, access restrictions, and emerging technologies fundamentally shape whether a delivery takes 30 minutes or 3 hours. Cities designed for sustainability and walkability create vastly different delivery challenges than sprawling car-dependent regions, requiring fundamentally different logistics strategies.

    The Traffic Congestion Challenge: Density and Vehicle Speed Trade-offs

    The relationship between urban density and traffic speed reveals a counterintuitive pattern critical for understanding delivery performance. Extremely dense urban areas with populations exceeding 4,000 residents per square mile experience significantly slower average vehicle speeds than suburban areas. Dense cities generate 96,545 vehicle miles per square mile compared to 46,700 in low-density areas, creating traffic intensities more than double their suburban counterparts.​

    During peak hours, this disparity becomes extreme. High-density areas experience 48% peak-hour delays compared to 23% in low-density suburbs. A delivery in downtown Manhattan or central London faces fundamentally different speed constraints than suburban deliveries, with total vehicle hours per square mile in dense areas reaching 2.6 times the rate of low-density regions. For delivery platforms, this means that geographical location dramatically impacts achievable delivery windows—a company promising 30-minute delivery in dense urban cores faces far greater operational difficulty than one serving suburban areas.​

    Counterintuitively, this density challenge coexists with the advantage that denser areas support more efficient delivery models. While individual vehicle speeds decrease in dense areas, the proximity of addresses enables deliveries per mile to increase substantially. A delivery driver in a dense neighborhood might complete 10-15 deliveries in an hour despite slower speeds, whereas a suburban driver might complete only 3-4 deliveries at faster speeds but over much longer distances.​

    The Parking Crisis: Lost Time and Operational Chaos

    Parking availability represents the single largest controllable factor undermining urban delivery efficiency. Delivery drivers spend enormous amounts of time simply searching for legal parking spaces to make stops—time that translates directly to delayed deliveries and increased costs. Approximately 50% of total logistics expenses in urban areas concentrate in the last-mile leg, with parking difficulties contributing substantially to this cost concentration.​

    A groundbreaking Seattle study tested real-time parking information systems providing delivery drivers live curb availability data. The results were dramatic: drivers provided with real-time parking information reduced cruising for parking time by 28% and total driving time on delivery routes by 16%. Put simply: a 2-hour delivery route with poor parking information became a 1.68-hour route with intelligent parking guidance.​

    The magnitude of this impact reflects parking’s outsized role in delivery operations. Without parking information, drivers spend 50+ seconds per delivery location simply cruising to find legal parking. When drivers target specific curb spaces they know are available, this cruising time drops dramatically. For dense urban areas where parking is scarce and competition fierce, intelligent parking systems represent among the highest-ROI infrastructure investments cities can make for delivery efficiency.​

    Yet most cities lack systematic parking information systems. San Francisco’s SFpark and Seattle’s OpenPark represent rare exceptions—smart cities implementing real-time sensor data and mobile apps directing drivers to available spaces. Without these systems, drivers resort to circling blocks repeatedly, generating unnecessary vehicle miles, pollution, and congestion.​

    Low-Emission Zones and Access Restrictions: Regulatory Complexity

    The explosion of Low-Emission Zones (LEZs) and Zero-Emission Zones (ZEZs) across global cities introduces profound operational complications for delivery services. Europe forecasts 507 total LEZs by 2025, up 40% from 2019, with restrictions expanding geographically and tightening over time. London’s Ultra-Low Emission Zone (ULEZ), Madrid’s comprehensive LEZ covering the entire municipality, and Rotterdam’s mandatory zero-emission zones for freight exemplify this trend.​

    These regulations fundamentally alter delivery feasibility. A vehicle legal for delivery in one zone may be banned in another 2 kilometers away, forcing companies to redesign routes, maintain separate fleets by vehicle type, or face hefty fines for violations. A diesel truck compliant in suburban areas might be entirely prohibited in central business districts during certain hours.​

    The compliance complexity creates cascading operational impacts. Delivery companies must map zones with different restriction timings—some LEZs operate only during business hours, others all day, others with graduated vehicle standards. A single delivery route might traverse multiple zones with conflicting requirements, necessitating either: expensive multi-vehicle operations with drivers switching vehicles at zone boundaries; longer circumnavigating routes avoiding restricted areas; or delivery time windows shifted to off-peak hours when restrictions don’t apply.​

    Santa Monica’s LEZ pilot demonstrated both opportunity and implementation challenge: participating delivery businesses achieved 50% greenhouse gas emissions reductions and 75% continued using zero-emission vehicles after the pilot ended. Yet achieving this required investment in electric vehicle fleets, charging infrastructure, and revised operational planning—substantial capital commitments beyond many small delivery companies’ budgets.​

    Urban Consolidation Centers and Microhubs: Infrastructure Innovation

    The most transformative infrastructure development for delivery efficiency is the emergence of strategically positioned consolidation centers and microhubs in urban cores. These micro-fulfillment centers (MFCs) and micro-consolidation centers (MCCs) represent a paradigm shift from centralized distribution toward distributed, localized inventory and fulfillment.​

    Microhubs function as transshipment points where bulk deliveries from regional distribution centers consolidate into smaller, localized shipments completed via sustainable last-mile vehicles (electric vans, cargo bikes, or foot couriers). A delivery truck makes one large consolidated stop at an urban microhub rather than multiple stops across the city, from which packages disperse via efficient last-mile methods.​

    The efficiency gains are substantial. Retailers implementing microhub networks achieve 30-50% reductions in delivery time compared to regional distribution center fulfillment. Some high-density urban zones achieve sub-2-hour delivery, transforming expectations around delivery speed. A regional grocery chain using in-store microhubs reduced average delivery time from 3 days to under 24 hours, increasing repeat order frequency by 18%.​

    Last-mile costs decrease dramatically—some grocers report 20-30% reductions in last-mile delivery costs after implementing microhubs. This cost reduction combines multiple factors: shorter delivery distances reducing fuel consumption; smaller delivery vehicles requiring less parking space and compliance; higher stop density enabling more deliveries per driver hour; and reduced vehicle wear-and-tear.​

    Environmental impacts are equally compelling. By positioning inventory within a few kilometers of final delivery destinations, delivery vehicles travel shorter distances, generating substantially fewer emissions. Microhub-based operations enable complete mode shifts to electric bikes or cargo vehicles—vehicles that function efficiently only for short distances but excel in dense urban environments.​

    Road Infrastructure Quality: The Rural Delivery Paradox

    While dense cities face traffic and parking challenges, rural and remote areas face distinctly different infrastructure constraints: inadequate road networks, poor pavement quality, and limited connectivity. A delivery to a poorly maintained rural road might require 4x the travel time of delivering to an equivalent distance on modern urban highways.​

    The infrastructure disparity creates divergent delivery economics. Urban density makes short delivery windows economically feasible despite traffic challenges. Rural areas’ poor infrastructure makes quick delivery expensive despite lower traffic congestion. This explains why same-day delivery thrives in dense urban cores but remains unavailable in many rural regions even when customers might be more willing to accept longer delivery windows.​

    Investment in rural road infrastructure directly impacts delivery capability. Communities improving road quality see delivery times and costs improve substantially—essential for rural e-commerce expansion and economic competitiveness.​

    Peak-Hour Dynamics and Temporal Infrastructure Constraints

    Infrastructure capacity isn’t static—delivery efficiency varies dramatically by time of day. Rush hour congestion dramatically reduces delivery speeds, whereas off-peak hours enable faster operations. Some cities implement “delivery windows” restricting commercial vehicle access during peak hours, forcing deliveries into early morning or evening hours.​

    This temporal constraint adds complexity to delivery planning. A promise of “2-hour delivery” might require off-peak time windows, limiting customer convenience during high-demand periods. Infrastructure investment—dedicated truck lanes, expanded road capacity, or off-peak enforcement—enables more flexible delivery timing.​

    London’s congestion charge, while primarily intended for passenger vehicles, inadvertently improved delivery vehicle traffic flow by reducing overall congestion. The charge reduced car trips into central London by approximately 25%, improving conditions for delivery vehicles despite higher congestion charge costs for commercial vehicles.​

    Technology Solutions Compensating for Infrastructure Gaps

    Where physical infrastructure is inadequate, technology increasingly compensates. AI-driven route optimization accounting for real-time traffic, weather, and infrastructure conditions enables delivery planning on minutes-by-minute basis rather than assuming static conditions. Dynamic rerouting redirects drivers around unexpected congestion, accidents, or access restrictions automatically.​

    Curb management systems like OpenPark represent critical infrastructure innovations—using sensors and apps to convert static parking scarcity into efficiently utilized shared resources. Similar systems managing loading zones and delivery access points maximize utilization of limited infrastructure.​

    Last-Mile Delivery Cost Structure and Infrastructure Impact

    Last-mile delivery accounts for 25-50% of total logistics costs and generates 25% of urban CO₂ emissions in some cities. This disproportionate cost concentration reflects infrastructure challenges: time spent searching for parking, navigating congestion, complying with access restrictions, and managing failed deliveries (requiring redelivery when customers aren’t home or access is impossible).​

    Infrastructure improvement directly improves this economics. A city implementing parking information systems might reduce per-delivery costs by 10-15% through parking time reductions. Microhub infrastructure enabling cargo bike last-mile reduces costs by 20-30% while improving speed and emissions. LEZ compliance requiring electric vehicles increases upfront costs but reduces operational fuel expenses and benefits from government incentives.​

    Multi-Modal Integration: Infrastructure Enabling Flexibility

    Modern delivery infrastructure increasingly embraces multi-modal solutions—trucks for bulk transport, consolidation at microhubs, then cargo bikes or e-vans for final-mile delivery. This model requires infrastructure supporting mode transitions: adequately sized microhubs, bike parking and charging infrastructure, vehicle sizing appropriate for narrow urban streets.​

    Cities with robust micro-mobility infrastructure—protected bike lanes, cargo bike parking facilities, e-vehicle charging networks—enable cost-effective sustainable delivery. Conversely, cities without this infrastructure force delivery back to energy-intensive vans or trucks even for short distances.​

    Public-Private Coordination: Shared Infrastructure Models

    Leading cities increasingly implement collaborative frameworks where municipal authorities and delivery operators share infrastructure. Time-segmented loading zones allow multiple carriers to use identical curb space during different hours. Shared microhubs reduce capital requirements by enabling multiple carriers to operate from single facilities. Municipal delivery tracking systems integrate commercial vehicle data with public infrastructure management.​

    These collaborative models multiply infrastructure efficiency. A shared microhub serving 5 delivery companies operates at higher utilization than would be achievable if each company operated private infrastructure. Time-shared loading zones ensure curbs remain fully utilized throughout the day rather than sitting empty off-peak.​

    Future Infrastructure Requirements: Preparing for Autonomous Delivery

    Emerging autonomous vehicle and drone delivery technologies require fundamentally different infrastructure. Autonomous vehicle operations require precision GPS, continuous connectivity, clear road markings, and complex intersection management. Drone delivery demands airspace management systems, landing pads or rooftop infrastructure, and geofence compliance.​

    Cities investing in this future infrastructure gain competitive advantage for next-generation delivery services. Conversely, cities with poor digital infrastructure, fragmented airspace governance, or complex regulatory frameworks will struggle to support autonomous delivery deployment.​

    Summary: Infrastructure as Delivery Competitive Advantage

    Urban infrastructure—from parking availability to road quality to LEZ restrictions to microhub presence—fundamentally determines delivery feasibility, speed, and cost. The most delivery-friendly infrastructure combines multiple dimensions: well-maintained road networks, intelligent parking information systems, collaborative public-private loading zone management, strategically positioned microhubs enabling mode shifts to sustainable vehicles, and streamlined access compliance for low-emission fleets.

    Cities prioritizing delivery infrastructure efficiency through parking information systems, microhub development, and collaborative logistics frameworks see measurable improvements: 15-30% delivery time reductions, cost decreases of 20-30%, emissions reductions of 25-50%, and dramatically improved customer satisfaction. Conversely, cities neglecting delivery infrastructure through restrictive access policies without sustainable alternatives, inadequate parking management, and lack of microhub development face deteriorating delivery reliability, increased costs, and congestion—ultimately harming both delivery companies and the residents they serve. The most successful urban logistics strategies recognize delivery infrastructure not as an afterthought but as critical community asset essential for economic vitality, environmental sustainability, and livable cities.

  • The Ultimate Guide to Customer Support for On-Demand Platforms

    The Ultimate Guide to Customer Support for On-Demand Platforms

    Exceptional customer support has become a critical competitive differentiator for ride-hailing and delivery platforms. As the market matures and customer expectations evolve, platforms that deliver superior support experiences capture disproportionate market share while those neglecting support face churn, negative reviews, and regulatory scrutiny. This comprehensive guide outlines contemporary best practices reshaping customer support across on-demand platforms.

    The Foundation: Omnichannel Support Architecture

    Modern customer support must operate across multiple communication channels seamlessly. Customers expect to initiate conversations via live chat, continue via email, and follow up through WhatsApp or phone calls without repeating themselves or losing context. The most sophisticated platforms unify all these channels into single inboxes where agents access complete customer histories regardless of communication method.​

    Omnichannel architecture requires three critical components: channel integration consolidating WhatsApp, Facebook Messenger, SMS, email, phone, and in-app chat into unified systems; unified customer profiles providing agents complete visibility into account history, past interactions, and customer preferences across all channels; and intelligent routing automatically directing messages to appropriate agents based on skill, workload, and customer tier.​

    DoorDash Customer Support Solutions exemplify this approach, providing white-labeled 24/7 support handling delivery-related inquiries with dedicated agents trained to represent restaurant brands. Rather than fragmenting support across multiple systems, comprehensive platforms maintain single repositories of customer interactions enabling consistent, contextual service.​

    AI-Powered Chatbots: Handling Routine Inquiries at Scale

    Artificial intelligence now handles 60-80% of support inquiries through conversational chatbots processing frequent questions without human intervention. Modern AI chatbots powered by natural language processing (NLP) and machine learning understand contextual meaning rather than matching rigid keyword patterns, enabling human-like conversations that resolve issues effectively.​

    Effective chatbot implementations handle specific inquiries: order status tracking (“Where is my delivery?”), refund requests (“How do I request a refund?”), account management (“Change my delivery address”), and policy questions (“What are your cancellation policies?”). Critically, chatbots must seamlessly escalate complex issues to human agents when necessary, creating fluid transitions that feel natural to customers.​

    Sentiment analysis AI detects customer frustration in real-time, automatically escalating emotionally charged issues to human agents before they escalate further. A frustrated customer expressing anger triggers immediate prioritization while satisfied customers receive quick, scalable bot responses. This sentiment-driven routing ensures human expertise concentrates on situations where emotional intelligence and complex problem-solving are essential.​

    By 2026, leading platforms implement AI cost-effectively at scale: platforms like BoldDesk, Zendesk AI, HubSpot, and Intercom deploy AI agents handling thousands of simultaneous conversations, reducing per-interaction costs from $15-25 to $0.50-2. This cost efficiency enables platforms to provide 24/7 support that would be economically infeasible through human-only teams.​

    Self-Service Knowledge Bases and Proactive Support

    Approximately 67% of support issues can be resolved through self-service if effective knowledge bases are available. Leading platforms invest heavily in comprehensive FAQ sections, searchable help articles, troubleshooting guides, and video tutorials enabling users to solve problems independently without contacting support.​

    Proactive support represents a critical evolution beyond reactive customer service. Rather than waiting for complaints, sophisticated platforms monitor patterns and reach out preemptively. If the platform detects a pattern of delivery delays in a specific area, automated notifications inform affected customers about the issue and expected resolution timeline. Early warning systems—detecting rising query volumes about specific topics—trigger immediate documentation updates and agent preparation.​

    Self-service extends across channels: knowledge base articles appear in email signatures, chat interfaces link to relevant support docs, and in-app messaging surfaces troubleshooting guides at moments when customers need them. This contextual help-on-demand reduces unnecessary support tickets while improving customer confidence.​

    AI-Assisted Agent Productivity

    Rather than replacing human agents entirely, the most effective platforms deploy AI copilots that augment agent capabilities. Real-time AI assistants suggest responses to customer messages, surface relevant knowledge articles, and automatically draft reply suggestions for agent review. These tools dramatically reduce “handle time”—the duration agents spend resolving issues—enabling single agents to resolve 30-40% more cases daily.​

    AI assistants also provide agents with historical context: summarizing prior interactions, highlighting customer account status (VIP, frequent complainer, new user), and flagging important details about previous issues. This contextual information enables agents to provide personalized, informed responses without extensive research.​

    Agent assist tools improve consistency by recommending standardized responses to common situations while allowing customization for individual cases. This balance maintains efficiency while preserving the human judgment essential for complex or sensitive situations.​

    Speed and First-Response Time Excellence

    Customer expectations for support responsiveness have become extremely demanding. Modern platforms target first-response times under 2-5 minutes across all channels. This speed requirement drives implementation of automated acknowledgments (immediate “We’ve received your message” confirmations) and intelligent triage (automatically assigning messages to appropriate agents).​

    Automated first-touch systems send immediate confirmation messages explaining expected response timeframes, providing case numbers for future reference, and offering self-service options, setting expectations while customers await human assistance. This transparency reduces anxiety and demonstrates responsiveness even before agents engage.​

    For time-sensitive issues—payment failures, delivery address corrections, safety concerns—platforms implement priority queuing ensuring rapid escalation. A customer messaging that they entered the wrong delivery address should receive near-immediate attention given the time-sensitive nature.​

    Personalization and Customer Data Utilization

    The most effective support experiences feel personalized rather than generic. Agents should reference customer history, account type, and prior interactions without requiring customers to repeat context. A customer’s third refund request receives different treatment than their first, reflecting different likelihood of legitimate issues versus potential abuse.​

    Delivery platforms leverage rich data to provide context: order history, typical spending patterns, preferred restaurants, past issues, payment methods, and even vehicle preferences for ride-hailing users. Agents equipped with this context can provide recommendations, prevent recurring issues, and tailor solutions to individual circumstances.​

    Advanced personalization extends to predictive support: systems analyzing customer patterns can identify users likely to experience issues and proactively reach out. If a user frequently places orders far from their typical location, the platform might offer navigation assistance or address verification to prevent delivery complications.​

    Dispute Resolution and Refund Management

    Refund management represents one of the most complex support challenges, particularly for delivery platforms where “missing item” claims can be fraudulent or legitimate. Sophisticated platforms implement multi-layered fraud detection combining behavioral analysis, image evidence, and pattern recognition to distinguish genuine issues from abuse.​

    Technology solutions streamline evidence collection: restaurants implement photo-at-pack systems capturing order completeness, tamper-evident packaging, GPS timestamps from driver handoffs, and detailed delivery notes. This visual evidence enables rapid resolution without relying solely on customer claims.​

    Dispute resolution systems should implement clear decision trees guiding support agents through scenarios: service failures warrant recovery restoring trust while suspicious patterns require escalation. Pattern detection identifies repeat claimants filing multiple requests within short periods, triggering additional scrutiny.​

    DoorDash’s Customer Support Solutions include dispute management tools, fraud detection capabilities, and refund reporting, enabling restaurants to address customer concerns while maintaining profitability. Leading platforms balance customer recovery with fraud prevention through structured policies and automated detection.​

    Proactive Communication Strategies

    Transparency about operational issues prevents support volume spikes. If a restaurant experiences unexpected delays, the platform should notify affected customers proactively rather than waiting for complaints. When delivery services experience disruptions due to weather, traffic, or technical issues, advance notification manages expectations.​

    Automated order status updates at key stages (confirmed, preparing, picked up, out for delivery) eliminate customer uncertainty. Delivery apps should provide realistic ETAs dynamically updated as conditions change, ensuring accuracy rather than setting false expectations.​

    Multi-channel notification strategies ensure customers receive updates through preferred channels: push notifications, SMS, email, or in-app messaging. Customers should control notification frequency, avoiding support fatigue while maintaining engagement.​

    Training and Team Empowerment

    Support excellence depends fundamentally on well-trained, empowered teams. Training programs should cover product knowledge, communication skills, conflict resolution, technical troubleshooting, and policy guidelines. Comprehensive onboarding ensures consistency across support agents while minimizing escalations.​

    Agent empowerment—granting authority to resolve issues without manager approval—reduces resolution times significantly. Agents authorized to issue refunds, provide credits, or make exceptions for customer satisfaction respond faster than those requiring approval chains. Empowerment should balance with guidelines preventing abuse: setting maximum refund amounts and requiring documentation.​

    Regular training updates address evolving products, policy changes, and emerging issues. Role-playing exercises with realistic scenarios prepare agents for complex interactions, building confidence in managing challenging situations. Ongoing coaching improves performance and prevents agent burnout.​

    Data-Driven Performance Management

    Leading platforms implement sophisticated analytics tracking support performance across multiple dimensions: first contact resolution (FCR)—percentage of issues resolved without escalation or follow-up; average handle time (AHT)—duration agents spend on individual cases; customer satisfaction (CSAT)—post-interaction surveys measuring customer satisfaction; net promoter score (NPS)—likelihood customers would recommend the platform.​

    Real-time dashboards provide managers visibility into team performance, enabling intervention when quality declines or backlogs develop. Sentiment analysis of support interactions identifies friction points where customers experience frustration. These data-driven insights drive process improvements more effectively than intuition-based decisions.​

    Complaint Categorization and Root Cause Analysis

    Effective support organizations systematically categorize complaints identifying recurring patterns. When multiple customers report identical issues within short periods, this signals operational problems requiring product or process changes. Feedback loops connecting support teams to product, operations, and engineering teams transform support insights into systematic improvements.​

    Common complaint categories for delivery platforms include missing items, incorrect orders, cold food (delivery delays), wrong address deliveries, and payment issues. Each category requires tailored prevention and response strategies. Root cause analysis traces complaints to underlying problems: if many complaints involve cold food, investigation might reveal restaurants consistently taking 30+ minutes to fulfill orders.​

    Technology Infrastructure for Modern Support

    Modern support platforms require robust technology infrastructure integrating multiple systems: CRM platforms (Salesforce, Microsoft Dynamics, HubSpot) storing customer data; help desk systems (Zendesk, Freshdesk, Intercom) managing tickets; communication platforms (Twilio, Slack, WhatsApp Business API) handling message delivery.​

    Leading delivery platforms build custom support systems optimized for their specific needs. DoorDash’s Customer Support Solutions leverage machine learning for fraud detection, integrated dashboards for operation monitoring, and API connections enabling seamless data flow between platforms.​

    Cloud-based infrastructure provides scalability essential for platforms handling millions of daily support interactions. On-demand capacity ensures response times remain fast even during demand spikes—restaurants closing suddenly, large-scale service disruptions, or natural disasters driving support volume increases.​

    Specialized Support for Drivers and Merchants

    Beyond customer support, sophisticated platforms provide dedicated support channels for drivers and merchants. Driver support addresses onboarding, payment issues, technical problems with driver apps, and delivery-specific issues. Merchant (restaurant) support helps businesses optimize performance, manage delivery operations, and resolve disputes.​

    Merchant support goes beyond reactive troubleshooting—providing proactive guidance on menu optimization, delivery fee management, promotional strategies, and integration with restaurant systems. Platforms like DoorDash provide merchant account managers offering strategic guidance rather than merely addressing complaints.​

    The Human Element: Empathy and Emotional Intelligence

    Despite technological sophistication, exceptional support ultimately depends on human qualities: empathy, patience, genuine concern for customer satisfaction, and ability to navigate complex human emotions. Agents should acknowledge customer frustration sincerely: “I understand how frustrating this must be” conveys recognition of legitimate concerns.​

    Training programs should emphasize emotional intelligence—ability to recognize and respond appropriately to customer emotions. A frustrated customer requires reassurance and acknowledgment while an angry customer requires swift action and empowerment. One-size-fits-all scripts fail because individual situations have unique emotional dimensions.​

    Following resolution, genuine follow-up demonstrates commitment to satisfaction: “I wanted to check that the refund was processed correctly” or “Did the solution we provided work for you?” converts problem resolution into relationship building.​

    Competitive Advantage Through Support Excellence

    Platforms distinguishing themselves through exceptional support capture disproportionate market share. Consumer research shows that superior customer service drives loyalty and repeat usage more effectively than lowest pricing. A customer who experienced one extraordinary support interaction will accept slightly higher prices rather than switching to competitors with mediocre support.​

    Conversely, platforms neglecting support face rapid churn. Negative support experiences propagate through social media and review platforms, reaching potential customers before they even try the service.​

    Summary: Building Sustainable Support Excellence

    Exceptional customer support in 2026 requires integrated strategy combining AI-powered automation, omnichannel infrastructure, well-trained empowered teams, and data-driven continuous improvement. Platforms succeeding in this space treat support not as a cost center minimizing expenses but as strategic asset generating loyalty, reducing churn, and enabling sustainable competitive advantage. The convergence of advanced AI chatbots, unified omnichannel platforms, real-time analytics, and human expertise creates support experiences that transform customer problems into opportunities for building lasting relationships and brand advocacy.

  • How AI Is Transforming Ride-Hailing and Delivery Services

    How AI Is Transforming Ride-Hailing and Delivery Services

    Artificial intelligence has become the fundamental technology reshaping ride-hailing and delivery platforms. Rather than a supplementary enhancement, AI now powers core operational systems—from dispatch algorithms to demand forecasting to fraud detection. The platforms implementing sophisticated AI systems are capturing disproportionate market share while delivering measurably superior user experiences.

    Dynamic Demand Prediction and Preemptive Driver Positioning

    Machine learning algorithms now predict ride demand with remarkable accuracy, enabling platforms to position drivers before surges materialize. Uber’s predictive models analyze historical data, weather conditions, local events, time of day, traffic patterns, and dozens of other variables to forecast demand spikes 15-30 minutes in advance. Rather than reacting to demand after it appears, these systems proactively position drivers in anticipated high-demand zones.​

    This predictive capability reduces average wait times substantially. Research demonstrates that integrating demand forecasting with vehicle relocation optimization decreases average waiting times by approximately 30% across all test cases and up to 55% in high-demand zones. For riders, this means consistently shorter wait times and higher ride availability during peak periods.​

    The same predictive capabilities apply to food delivery. DoorDash’s demand forecasting system analyzes historical order patterns, seasonal trends, time of day, and local events to predict what restaurants will be overwhelmed and which will have capacity. This enables the platform to intelligently distribute orders across restaurants, preventing bottlenecks while ensuring consistent delivery performance. For restaurants, this intelligence enables better inventory management—kitchen staff know exactly what to prepare and when.​

    Intelligent Real-Time Dispatch and Matching

    Modern dispatch systems employ optimization algorithms paired with machine learning to solve what researchers call “the dispatch problem”—assigning hundreds of thousands of orders to appropriate drivers simultaneously while minimizing total delivery time. DoorDash’s dispatch system combines machine learning predictions with advanced optimization to consider multiple factors: driver location and vehicle type, restaurant location and current preparation status, traffic conditions, customer location, and historical performance data.​

    The system operates on a timeline of seconds—evaluating millions of potential assignments and selecting optimal matches continuously. Critically, these systems learn from outcomes: when actual delivery times differ from predictions, the system captures this variance and incorporates it into future predictions. This continuous learning loop means dispatch efficiency improves over time as the system accumulates more data.​

    For ride-hailing, intelligent matching considers more than just proximity. Uber’s matching algorithm evaluates driver-rider compatibility based on historical patterns, user preferences, ratings, and trip routes. A driver with consistently high ratings for long trips might be preferentially matched with longer-distance riders, while drivers excellent at quick airport runs receive airport requests. This nuanced matching reduces cancellations and improves satisfaction for both parties.​

    Precise Estimated Time of Arrival (ETA) Prediction

    ETA accuracy represents a critical competitive differentiator. Early ETA systems employed simple mathematical models: calculate distance, divide by average speed. Modern systems employ deep learning models processing continuous data streams—real-time traffic data, weather conditions, historical performance patterns for specific routes, driver behavior patterns, and current network congestion.​

    Uber Eats developed a sophisticated “Trip State Model” using smartphone motion sensors and GPS data to understand precisely what drivers are doing at each moment: traveling to restaurant, searching for parking, walking to pickup point, waiting for order, en route to customer. By identifying these micro-states accurately, the system predicts preparation time and delivery completion with exceptional accuracy.​

    This precision enables optimization at multiple levels. The system can dispatch drivers to arrive at restaurants precisely when food preparation completes, eliminating driver wait time. For customers, accurate ETAs reduce anxiety and enable better planning of their evening. The cumulative impact of improved ETAs across millions of daily orders significantly improves user satisfaction and repeat usage.​

    Route Optimization and Real-Time Traffic Integration

    AI-powered route optimization analyzes continuously updated traffic conditions, weather disruptions, road closures, and delivery volume to determine optimal routes dynamically. Unlike traditional GPS navigation optimizing for shortest distance, delivery platform routing optimizes for fastest delivery while accounting for traffic patterns, driver fuel efficiency, and package consolidation. Uber Eats’ route optimization reduces delivery times by up to 25%, ensuring fresher food arrives faster.​

    The system updates routes in real-time as conditions change. If an accident blocks the primary route, the system automatically redirects drivers through optimal alternative paths without requiring driver input. Weather-aware routing accounts for how conditions affect actual driving speed—rain significantly reduces optimal speeds and increases realistic delivery windows. These micro-optimizations compound across millions of daily deliveries to generate substantial efficiency gains.​

    Dynamic Pricing and Surge Management

    AI algorithms manage dynamic pricing by continuously analyzing supply-demand balances, competitive pricing, and market conditions. Rather than simple multiplier-based surge pricing, modern systems employ sophisticated pricing models that optimize for multiple objectives: incentivizing driver participation during peak times, managing customer demand elasticity, and maximizing platform revenue. Machine learning systems learn which price points optimize for desired outcomes—often balancing driver incentives with customer acquisition rather than purely maximizing per-ride revenue.​

    Personalized pricing extends further: some platforms employ AI systems that estimate individual customer price sensitivity based on past behavior, account history, and even real-time behavioral signals. A customer with low battery (potentially desperate) might see higher surge prices than a customer actively browsing ride options. While ethically controversial, these systems arguably optimize allocation toward users with genuine need.​

    For food delivery, AI-driven pricing analyzes demand forecasts, restaurant availability, competitor pricing, and delivery difficulty to adjust fees dynamically. DoorDash’s system incorporates real-time demand signals to implement surge pricing during peak hours while using AI to predict off-peak discounts that drive incremental demand.​

    Personalized Recommendations and User Experience

    AI recommendation engines analyzing user behavior generate highly personalized meal suggestions. Swiggy’s recommendation system identifies food preferences based on order history, location, time of day, and behavioral signals to surface dishes users are most likely to order. Uber Eats and DoorDash employ similar systems that analyze browsing patterns, item views without purchases, and implicit preferences derived from search behavior.​

    These recommendation systems generate measurable impact: users encountering personalized recommendations place larger orders, increased order frequency, and spend more per order compared to users browsing generic “popular” sections. The system benefits both users—who discover items matching their preferences—and platforms—which increase transaction value.​

    Beyond food recommendations, AI personalizes entire user experiences. Pricing, promotions, and discounts are customized per-user based on price sensitivity, purchasing patterns, and engagement history. Users likely to order without discounts see full-price offers while price-sensitive users receive targeted promotions. This personalization increases conversion and order volume.​

    Fraud Detection and Security

    AI systems detect fraudulent activities across multiple dimensions: payment fraud, identity theft, fake accounts, and restaurant-side violations. Fraud detection algorithms analyze transaction patterns identifying anomalies: unusual payment methods, geographic inconsistencies, rapid successive transactions, and other suspicious signals. By embedding generative AI into fraud detection systems, some platforms have improved fraud detection rates by as much as 300%.​

    For delivery platforms, image recognition AI examines delivery photos to detect package tampering, damage, and delivery errors, preventing false claims and ensuring delivery integrity. Driver behavior monitoring tracks driving patterns identifying dangerous behaviors—hard braking, excessive speeding, aggressive maneuvers—enabling intervention to improve safety.​

    Inventory Management and Kitchen Optimization

    Food delivery platforms employ AI to optimize restaurant inventory and kitchen operations. DoorDash’s system analyzes demand forecasts and historical patterns to predict which menu items will be popular, enabling restaurants to prepare optimal inventory levels. This reduces food waste from overstocking while preventing shortage-related delays from understocking.​

    AI also optimizes kitchen staffing and equipment utilization by predicting order volumes and meal preparation times, enabling restaurants to schedule labor and manage capacity more efficiently. Zomato uses AI to identify trending food items and create personalized menus, increasing engagement and driving repeat orders.​

    Autonomous Vehicle Integration and Robotaxis

    The most transformative AI development is autonomous vehicle integration. Robotaxis powered by advanced AI systems are transitioning from experimental pilot programs to commercial operation across major U.S. cities. Waymo operates fully driverless robotaxi services across multiple markets, with Amazon’s Zoox, Tesla, and Uber pursuing aggressive robotaxi deployment timelines. Nvidia’s DRIVE platform and Mercedes-Benz integration indicate that robotaxi technology is approaching mainstream commercialization.​

    Remote monitoring represents a critical safety innovation—rather than removing human oversight entirely, companies are implementing remote human operators who can monitor and intervene in robotaxi operations when needed. This hybrid approach maintains safety while improving scalability.​

    For autonomous delivery, robots are navigating sidewalks at scale in pilot programs, addressing last-mile delivery challenges for package delivery and meal delivery. These systems employ computer vision, LIDAR sensors, and path-planning algorithms to navigate complex urban environments safely.​

    Boston Consulting Group projects that by 2035, robotaxis could comprise 700,000 to 3 million vehicles globally, potentially replacing 55-85% of ride-hailing and taxi trips in major developed cities. Operational break-even is estimated within seven years as technology matures and manufacturing scales.​

    Real-Time Analytics and Decision Optimization

    Modern platforms process billions of data points daily through ML pipelines that continuously optimize performance. Lyft’s real-time monitoring tracks model performance metrics like latency and accuracy, enabling rapid identification and correction of degrading models. When DoorDash detected unexpected changes in customer ordering patterns and external factors affecting model performance, real-time monitoring enabled rapid retraining, preventing operational disruptions.​

    This continuous optimization extends to A/B testing at massive scale—platforms test thousands of variations simultaneously (UI changes, pricing models, recommendation algorithms, matching strategies) to identify improvements generating measurable impact. The rapid iteration enabled by these systems compounds to substantial cumulative improvements.​

    Chatbots and Conversational AI for Customer Support

    Natural language processing and generative AI power customer service chatbots handling 80% of routine inquiries (tracking orders, reporting issues, processing refunds) instantly while escalating complex problems to human agents. These systems understand conversational context and provide helpful information without frustrating users with rigid menu-based support.​

    Voice ordering represents an emerging frontier—AI systems understand natural language voice commands enabling hands-free ordering for accessibility and convenience. Users can simply state “I’d like a large pepperoni pizza with extra cheese and light sauce” and the system processes the entire order without requiring manual selection.​

    Traffic Management and Urban Optimization

    City-level AI systems coordinate ride-hailing and delivery vehicles with broader transportation infrastructure. AI manages traffic signals, adjusts timing based on real-time flow data, and coordinates vehicle routing across entire metropolitan areas. This systemic optimization reduces congestion that would otherwise result from increased ride-hailing and delivery vehicle volumes.​

    Implementation Challenges and Future Evolution

    Despite remarkable achievements, AI systems in ride-hailing and delivery face ongoing challenges: model degradation as user behavior shifts, edge cases and safety scenarios not adequately represented in training data, and the computational overhead of real-time optimization at global scale. Robustness and interpretability remain areas requiring continued development.​

    Future evolution will likely involve “agentic AI”—systems operating more autonomously and making independent decisions within defined parameters. These systems could dynamically adjust pricing, modify dispatch strategies, and coordinate vehicle fleets without continuous human oversight. The emergence of multimodal AI combining vision, language, and reasoning capabilities will enable more sophisticated understanding of complex scenarios.​

    Competitive Implications

    The platforms implementing the most sophisticated AI systems are capturing disproportionate market share. Uber’s superior ETA predictions, route optimization, and demand forecasting create compound advantages in user experience and operational efficiency. DoorDash’s dispatch optimization and restaurant partnership analytics enable delivery times competitors struggle to match. These technical advantages translate directly to competitive moats that smaller competitors find difficult to overcome.​

    Summary: AI as Foundational Infrastructure

    AI has evolved from an optional optimization layer to the foundational infrastructure enabling modern ride-hailing and delivery. Platforms without sophisticated AI systems for demand prediction, dispatch optimization, and personalization will increasingly struggle against competitors leveraging these technologies systematically. The convergence of autonomous vehicles, real-time optimization, and personalization represents the next evolution—creating fully autonomous, AI-orchestrated transportation and delivery ecosystems that would have seemed impossible a decade ago. For riders and customers, this evolution promises faster service, lower costs, better user experiences, and ultimately, fully autonomous fleets that eliminate human limitations in safety, efficiency, and responsiveness.

  • Top 7 Features to Look for in a Delivery App in 2026

    Top 7 Features to Look for in a Delivery App in 2026

    The delivery app landscape has matured significantly, and 2026 demands a new standard of functionality. Users now expect sophisticated features that go beyond basic ordering and tracking. These seven essential features distinguish exceptional delivery apps from mediocre competitors.

    1. AI-Powered Personalized Recommendations

    Modern delivery apps employ machine learning algorithms that analyze individual user behavior to predict preferences and suggest meals users are most likely to order. These systems consider purchase history, time of day, weather conditions, seasonal preferences, and even mood patterns derived from ordering times. When users open the app, the personalized feed immediately surfaces dishes and restaurants tailored to their specific tastes rather than generic top-rated options.​

    The sophistication of these recommendation engines significantly impacts user engagement and order frequency. Apps with advanced AI recommendations see higher average order values (AOV) and increased repeat orders compared to apps relying on static content. Approximately 52% of consumers actively seek personalized recommendations, indicating strong user preference for this feature. The most effective implementations learn from implicit signals (which items users view but don’t order, how long they browse specific restaurants) alongside explicit data (past orders, favorite items).​

    Beyond meal recommendations, AI predicts optimal timing—suggesting Indian food on Monday evenings when users typically crave it, or breakfast items on Saturday mornings. This contextual intelligence eliminates friction by eliminating the need for users to think about what they want; the app simply presents the right option at the right moment.​

    2. Seamless Real-Time Order Tracking with Interactive Maps

    Real-time order tracking has evolved from a nice-to-have to an absolute requirement. Users expect live GPS visibility of their order’s journey from restaurant acceptance through driver pickup to arrival at their doorstep. The most effective implementations display order status through multiple channels simultaneously: interactive maps showing driver location, text status updates (“Order being prepared,” “Out for delivery”), and push notifications at each stage.​

    Interactive map displays demonstrate the driver’s real-time location, remaining distance, estimated arrival time, and route details. Rather than static status updates, sophisticated apps update ETAs dynamically as conditions change, accounting for actual traffic patterns and driver behavior. This transparency builds trust by ensuring customers never feel uncertain about their order’s whereabouts.​

    Beyond passenger-facing tracking, advanced systems provide visibility into the entire order lifecycle: time from order placement to restaurant acceptance, kitchen preparation duration, driver pickup time, and delivery duration. This granular visibility helps users understand where delays occur and informs future ordering decisions. Some platforms enable direct communication with drivers through the tracking interface, allowing customers to specify delivery instructions without phone calls.​

    3. Comprehensive Search and Filtering Capabilities

    Food cravings are specific, and delivery apps must enable rapid discovery through multiple search dimensions. Advanced search functionality should support cuisine type filtering (Indian, Italian, Mexican), dietary restrictions (vegan, keto, gluten-free, halal), delivery time windows, price ranges, ratings, and specific ingredients or dishes. The most effective implementations combine keyword search with intelligent filtering that prevents overwhelming result sets.​

    Smart filtering reduces the decision paralysis that occurs when users are presented with hundreds of restaurant options. Instead of browsing endlessly, users can narrow results by “Delivered in under 30 minutes,” “Top rated today,” “Best value,” or “Currently open”. Multi-level filtering enables increasingly specific searches: first by cuisine, then by price, then by delivery time, progressively narrowing options until users find the perfect choice.​

    Search history and saved filter combinations further enhance efficiency for returning users who regularly filter by identical criteria (e.g., “vegan restaurants, under 30 minutes, under $15”). Voice search capabilities enable hands-free discovery for users multitasking or driving.​

    4. Frictionless One-Tap Checkout with Multiple Payment Options

    Checkout represents the critical conversion point. Apps must minimize friction by enabling order completion in under two minutes through streamlined flows that eliminate redundant data entry. Returning users should encounter prefilled payment methods and delivery addresses, allowing genuine one-tap checkout for frequently repeated orders.​

    Payment flexibility is essential—apps should support credit cards, digital wallets (Google Pay, Apple Pay), UPI, PayPal, buy-now-pay-later services, and cash-on-delivery for users in markets where digital payment adoption is still growing. Secure payment gateways with fraud detection protect user data at every transaction step. Clear payment processing feedback prevents users from wondering whether transactions completed successfully.​

    For returning customers with established order patterns, “Reorder with one tap” buttons that instantly repurchase previous orders dramatically reduce friction and increase conversion. This feature proves particularly powerful for regular users who consistently order identical meals.​

    5. Accessibility and Inclusive Design Features

    Accessibility represents both an ethical imperative and a competitive advantage in 2026. Delivery apps should support screen readers (iOS VoiceOver, Android TalkBack) for visually impaired users, enabling full app navigation through audio feedback. High color contrast between text and backgrounds ensures readability for users with low vision. Resizable fonts and support for dynamic type scaling accommodate varied visual abilities.​

    Voice ordering functionality enables hands-free ordering for users with mobility impairments or those multitasking (driving, cooking, caring for children). Voice ordering systems should support natural language processing, understanding conversational orders like “I’d like a large pizza with extra cheese and no onions”. These systems benefit not just users with disabilities but also busy professionals and multitasking parents.​

    Keyboard navigation should work throughout the app, allowing users unable to use touchscreens to navigate effectively. Touch targets (buttons, links) should be sufficiently large (minimum 48×48 pixels) to accommodate users with motor impairments. For users with cognitive impairments, clear language, logical content organization, and predictable navigation reduce cognitive load.​

    Captions and transcripts for video content (restaurant promotional videos, cooking demonstrations) support users with hearing impairments. Haptic feedback (subtle vibrations) provides tactile confirmation for actions without requiring visual feedback.​

    6. Intelligent Loyalty and Rewards Programs

    Modern loyalty programs transcend simple point accumulation. The most effective 2026 programs employ tiered rewards systems where customers unlock progressively better benefits as engagement increases, creating aspirational goals that drive retention. Swiggy Super and Amazon Prime demonstrate this approach: for fixed monthly fees, members receive unlimited free delivery, surge pricing discounts, and exclusive offers.​

    Gamification elements boost engagement by making loyalty feel like interactive play rather than transactional earning. Spin-the-wheel bonuses, milestone celebrations, and achievement badges create moments of delight. Personalized rewards that match individual preferences (offering coffee credits to users who frequently order beverages, vegetarian meal discounts to vegetarian users) prove more valuable than generic rewards.​

    Sustainability-aligned rewards represent a growing dimension—apps can reward users for choosing eco-friendly packaging, slower delivery windows, or ordering from sustainable restaurants. Referral programs incentivizing users to invite friends through exclusive bonuses create network effects that drive acquisition.​

    The most sophisticated programs integrate across channels: points earned in-app synchronize with in-store purchases or partner brands, creating seamless omnichannel loyalty. Integration with digital wallets enables immediate redemption without friction.​

    7. Sustainability and Environmental Impact Transparency

    Consumer consciousness around environmental impact has become a decision factor in 2026. Leading delivery apps now calculate and display the carbon footprint of delivery options, helping users make eco-conscious choices. Some platforms quantify impact: “Choosing standard delivery instead of express saves 15kg CO₂”. Others reward sustainable choices: users selecting eco-friendly packaging or slower delivery receive points redeemable for discounts.​

    Sustainability transparency extends to restaurant and delivery partner features. Apps highlight restaurants using sustainable sourcing or packaging, helping environmentally conscious users align purchases with values. Carbon accounting systems track cumulative environmental impact from an individual user’s ordering history, creating awareness and enabling performance comparisons with other users.​

    Delivery method alternatives represent another critical dimension. Apps should highlight sustainable delivery options like cargo bikes, electric vehicle deliveries, or local pickup points that consolidate multiple orders into single trips. Some platforms display estimated delivery times and emissions for each option, enabling informed choice. Eco.me (Ele.me’s sustainability initiative) pioneered “e-Carbon” accounts that track and reward users for low-carbon choices like “no cutlery” orders.​

    Partnership with green-certified carriers or commitment to electric vehicle fleet adoption demonstrates institutional commitment to sustainability. Click-and-collect options that shift customers from delivery to pickup reduce last-mile emissions while boosting in-store engagement.​

    Additional Critical Features Worth Monitoring

    Beyond these core seven, several emerging features are rapidly becoming expected:

    Advanced customer support with AI chatbots: 24/7 AI-powered chat handling 80% of routine inquiries (missing items, order delays, refunds) instantly while escalating complex issues to humans seamlessly. Users increasingly expect immediate support without waiting for human agents.​

    Dark mode and eye-friendly design: Approximately 50-70% of mobile users enable dark mode when available. Dark mode reduces eye strain during evening use (when food delivery peaks) and improves battery life on OLED devices.​

    Order history with intelligent reordering: Complete order history enabling single-tap reordering of entire previous meals or selective item reordering without duplicating entire orders.​

    Multiple saved addresses: Users should save home, work, and other frequent locations, selecting delivery addresses with one tap.​

    Smart notifications: AI-driven push notifications timed for maximum engagement without annoying frequency. Personalized offers based on individual preferences and behavior patterns drive higher redemption than generic promotions.​

    Integration with smart home devices and voice assistants: Seamless ordering through Alexa, Google Home, or other voice assistants enables integration into smart home ecosystems.​

    Implementation Priority Framework

    Delivery platforms should prioritize implementations strategically. Essential foundations include minimalist navigation, high-quality food imagery, seamless checkout, and real-time tracking—absolute requirements that users take for granted. Secondary implementations like AI personalization, comprehensive accessibility, and sustainability features should follow core functionality, as these drive competitive differentiation and user satisfaction.​

    The most successful delivery apps in 2026 will seamlessly balance aesthetic appeal with functional usability, delivering experiences that feel intuitively designed for each individual user while maintaining the technical performance standards that have become table stakes. Apps excelling across these seven dimensions—personalization, tracking, search, checkout, accessibility, loyalty, and sustainability—will capture disproportionate market share from competitors relying on outdated feature sets.

  • Understanding Surge Pricing: What Riders Should Know

    Understanding Surge Pricing: What Riders Should Know

    Surge pricing represents one of the most contentious aspects of modern ride-hailing, fundamentally reshaping how users pay for transportation. Understanding its mechanics, triggers, and strategic countermeasures empowers riders to make informed decisions and minimize costs.

    How Surge Pricing Works: The Fundamentals

    Surge pricing, officially called “dynamic pricing” by Uber or “Prime Time” by Lyft, is an algorithmic system that adjusts fares in real-time based on the relationship between passenger demand and available drivers. When demand for rides exceeds the supply of drivers in a specific area, prices automatically increase to incentivize more drivers to head toward the high-demand zone and to discourage riders from requesting less urgent trips.​

    The system operates through sophisticated geospatial mapping where cities are divided into small zones called geohashes or hexagons. Each zone is constantly monitored for imbalances between rider requests and available drivers. When a zone experiences a surge, the app calculates a dynamic multiplier that increases the base fare by a percentage. A ride that normally costs $10 might become $15-$20 (1.5x to 2x multiplier) during peak demand periods.​

    The Technology Behind Dynamic Pricing

    Modern surge pricing algorithms employ advanced machine learning and artificial intelligence to optimize pricing decisions continuously. Uber’s pricing engine updates every 30 seconds, constantly scanning multiple geographies, user densities, and driver behavior. Rather than simply reacting to current demand, predictive AI models trained on millions of ride data points forecast demand spikes before they occur.​

    Machine learning models like LSTM (Long Short-Term Memory) networks analyze numerous factors to predict demand, including time of day, weather conditions, traffic patterns, special events, historical data trends, and driver availability. This predictive capability enables platforms to preemptively adjust pricing, staying ahead of demand fluctuations.​

    Uber has also transitioned from traditional multiplicative surge pricing (multiplying base rates by a factor like 2.0x) to more sophisticated additive surge models that provide bonuses to drivers based on absolute amounts rather than percentages. This distinction matters because additive models avoid distorting incentives for longer trips that might be disproportionately profitable under multiplicative systems.​

    When and Why Surge Pricing Activates

    Surge pricing triggers during predictable peak demand periods and unpredictable supply shocks. Predictable peak times include morning rush hour (6-9 AM), evening rush hour (5-8 PM), late-night weekends (9 PM-3 AM), and days following major events like concerts or sports games. During these periods, massive numbers of people simultaneously need transportation, overwhelming available driver capacity.​

    Weather-triggered surges occur during heavy rain, snow, or other adverse conditions that reduce driving comfort, increase accidents, and limit driver participation. During severe weather, fewer drivers are willing to drive, while more passengers avoid other transportation modes like walking or public transit.​

    Special event surges happen after concerts, sporting events, or other large gatherings when thousands of attendees depart simultaneously, creating overwhelming demand in concentrated areas. Airport peak surges coincide with major arrival and departure windows when volumes of travelers need ground transportation simultaneously.​

    Activation thresholds vary by platform and geography but typically trigger when expected wait times exceed certain durations (often 10-15 minutes) or when driver utilization falls below acceptable levels. Algorithms optimize for reliability—ensuring passengers can actually get rides—rather than purely maximizing revenue.​

    The Extent of Price Increases

    Surge multipliers vary globally and by regulation. In the United States, Uber and Lyft surges typically range from 1.5x to 3.0x or higher during extreme circumstances. India’s Motor Vehicle Aggregators Guidelines 2025 recently increased the maximum surge multiplier from 1.5x to 2.0x during peak hours. Philippines regulations cap surge pricing at specific rates tied to per-kilometer and per-minute fees. Some regions like San Francisco and New York City have implemented caps limiting surge multipliers to specific percentages.​

    Real-world impact demonstrates the significance of these multipliers. A base fare of ₹100 becomes ₹200 under a 2x multiplier during Indian peak hours. For longer rides with ₹200 base fares, a 2x multiplier results in ₹400 charges—substantial increases that directly impact rider budgets.​

    Personalized Surge Pricing: The Hidden Layer

    Beyond visible surge multipliers, Uber implements personalized surge pricing that charges different riders different prices for identical routes based on individual user profiles. A 2021 Uber patent filing describes a system estimating individual willingness to pay based on past behavior, ride urgency, and even device characteristics like low battery levels. The assumption: users with dying phone batteries are less likely to wait or comparison shop.​

    This personalized approach means two people standing side-by-side may see different surge prices reflected in their app. The algorithm analyzes individual user data—historical ride patterns, typical spending levels, price sensitivity, and current app behavior—to dynamically adjust prices optimized for each person’s likelihood of acceptance.​

    The Behavioral Psychology Behind Surge Pricing

    Beyond algorithmic calculation, platforms employ behavioral design principles to make surge pricing more psychologically acceptable. Rather than displaying abstract multipliers (like “2.5x”), modern apps show total fare estimates in actual currency, anchoring riders to real monetary amounts and reducing emotional resistance. This framing technique—displaying “$50 total” rather than “2.5x multiplier”—makes the fare feel less manipulated.​

    Time-pressure nudges like “Surge pricing may end soon” create artificial urgency and FOMO (Fear of Missing Out), driving riders to lock in rides quickly. MIT research shows that displaying “ending soon” messages increases ride confirmation rates by 38% during surge periods. Visual representations like heat maps showing surge zones glowing red create visual hierarchies that inform drivers while subtly manipulating perception through color intensity.​

    Regulatory Caps and Policy Responses

    The regulatory landscape for surge pricing is rapidly evolving as governments respond to consumer complaints about “price gouging.” India’s MVAG 2025 permits ride-hailing companies to charge up to 2x base fares during peak hours. Philippines regulations require surge pricing not to exceed per-kilometer and per-minute rate combinations. Maharashtra, India caps surge at 1.5x with discounts up to 25% during off-peak hours while mandating drivers receive at least 80% of fares.​

    San Francisco and New York City have implemented commission caps limiting platform fees, indirectly constraining pricing flexibility. Some jurisdictions are exploring more aggressive interventions, including government-set maximum multipliers and fees for platforms violating caps.​

    Strategies to Minimize Surge Pricing Costs

    Riders have multiple tactical and strategic options to reduce surge pricing impact:

    Timing adjustments: The simplest strategy involves avoiding peak times when possible. Waiting 10-15 minutes for surge prices to decline can save significant amounts—surge periods typically last 5-20 minutes as drivers respond and demand diminishes. Checking the driver app (available without active driving) reveals real-time surge zones visualized by color intensity. Physically walking away from high-surge zones into adjacent areas outside surge areas can reduce fares dramatically.​

    Pooled/shared rides: UberX Share and Lyft Line offer substantially lower fares—approximately 79% cheaper per passenger than solo rides. While shared rides add 8-15 minutes to journey time and require proximity matching with other riders, the savings can exceed $10-20 per trip. Shared rides remain underutilized by riders who prioritize privacy and speed over cost savings.​

    Subscription discounts: Uber One provides approximately 5% discounts on fares for $9.99/month or $99/year. While 5% savings won’t eliminate surge pricing costs during 2x multipliers, they provide modest cushions on regular trips.​

    Comparative app checking: Lyft’s Prime Time pricing doesn’t always surge identically with Uber, creating opportunities for cost-conscious riders. Checking both apps before booking can reveal 10-30% price differences for identical routes.​

    Strategic ride cancellation: If offered a surge ride, declining and checking again one minute later sometimes yields lower fares as algorithms test rider price elasticity. However, this strategy requires accepting longer wait times and risks no drivers accepting lower fares.​

    Public transportation alternatives: For short-distance urban trips, public transit, cycling, or walking may become cheaper and faster than surge-priced rides, particularly during peak periods.​

    The Driver Perspective: The Other Side of Surge

    Surge pricing creates complex incentives and challenges for drivers. Higher prices during surges significantly increase driver earnings—research shows drivers earn 20-50% more during surge periods. A driver earning $15/hour baseline might earn $22-25/hour during 1.5x surges, creating meaningful income improvements.​

    However, platforms capture substantial portions of surge increases. Commission structures averaging 20-25% mean platforms retain most surge value while drivers receive base earnings plus moderate bonuses. Additionally, surge-chasing behavior creates inefficiencies—drivers clustering in high-surge zones create local supply gluts that collapse surge periods.​

    Drivers also face the tradeoff between surge opportunity costs (working during low-surge periods) and vehicle expenses. With fuel and maintenance consuming 30-40% of gross revenues, surge opportunities become essential for profitability rather than supplementary income.​

    Consumer Fairness Perceptions and Brand Loyalty

    Despite economic efficiency arguments, surge pricing generates significant fairness concerns among consumers. Survey research shows 52% of consumers perceive dynamic and surge pricing as equivalent to price gouging. Wendy’s faced swift public backlash when attempting to implement restaurant surge pricing, forcing the company to reverse course despite potential efficiency benefits.​

    The fairness perception distinction is revealing: consumers accept surge pricing from Uber but rejected identical pricing from Wendy’s, suggesting contextual acceptance. Ride-hailing consumers perceive surge pricing as necessary for supply-demand balancing and inherent to transportation markets. Food retail pricing appears exploitative because consumers view food as essential and expect stable prices based on production costs.​

    This distinction holds important implications for brand loyalty. Platforms that lack transparency about pricing—making surge increases appear arbitrary—face greater reputational damage. Conversely, platforms explicitly explaining surge pricing mechanics maintain higher consumer trust.​

    Future Trajectory and Industry Evolution

    The surge pricing model faces mounting pressures from regulatory caps, consumer advocacy, and emerging alternatives. Autonomous vehicles may eventually eliminate surge pricing by providing unlimited supply elastic to demand. Electric vehicles adoption could reduce operational costs, lowering baseline pricing and reducing surge magnitude. More sophisticated algorithms may predict and preempt surges before they fully develop, reducing visible price spikes.​

    However, fundamental economic dynamics—demand exceeding supply during specific periods—will likely persist until transportation supply expands to match peak-hour demands. This reality ensures surge pricing mechanisms remain essential for balancing interests, despite ongoing consumer resistance.

    Key Takeaways for Riders

    Surge pricing operates as a supply-demand equilibrium mechanism rather than price gouging, though this distinction requires understanding its mechanics and impacts. Riders who recognize predictable surge patterns, understand personalized pricing implications, and employ tactical alternatives (timing, pooling, app comparison) can substantially reduce costs. Simultaneously, supporting regulatory efforts ensuring pricing transparency and reasonable caps protects consumer interests while maintaining driver incentives. The most effective rider strategy involves viewing surge pricing not as arbitrary price increases but as predictable market dynamics, enabling proactive behavioral responses that protect both personal budgets and transportation platform sustainability.

  • Mobile App Design Trends All Delivery Platforms Should Follow

    Mobile App Design Trends All Delivery Platforms Should Follow

    The mobile app landscape for delivery platforms is rapidly evolving, driven by rising user expectations, technological innovations, and competitive pressures. Delivery platforms that fail to adopt current design trends risk losing market share to competitors who deliver superior experiences. The most successful platforms in 2025-2026 share common design principles centered on personalization, performance, accessibility, and seamless user interactions.

    Hyper-Personalization Through AI and Machine Learning

    The most transformative trend reshaping delivery app design is hyper-personalization powered by artificial intelligence and machine learning. Unlike traditional personalization based on broad user segments, modern delivery apps employ real-time, contextual personalization that adapts to individual user behavior. Approximately 80% of consumers are more likely to engage with services offering personalized experiences, and this preference is particularly pronounced in the competitive delivery market.​

    Effective AI-driven personalization in delivery apps operates across multiple dimensions. Machine learning algorithms analyze user purchase history, browsing patterns, time of day preferences, location data, and even dietary preferences to generate tailored restaurant and meal recommendations. For example, if a user consistently orders breakfast items in the morning or frequently selects vegan options, the app learns these patterns and proactively surfaces relevant restaurants and dishes before the user searches. Real-time recommendation engines that analyze user interactions continuously update suggestions, ensuring relevance evolves with changing preferences.​

    The business impact is substantial. Delivery apps implementing sophisticated recommendation systems see increased average order values through intelligent upselling and meal pairing suggestions. Personalization algorithms reduce bounce rates by presenting users with meals they are most likely to crave, eliminating the friction of endless browsing through irrelevant options. Location-based personalization takes this further, suggesting nearby restaurants with short delivery times or promoting special offers based on the user’s current or frequently visited locations.​

    Voice-activated ordering represents an emerging personalization frontier. Integrating AI-driven recommendation engines with voice assistants enables customers to place orders through voice commands while receiving personalized suggestions hands-free. This modality particularly appeals to users on the go or those preferring touchless interactions.​

    Minimalist and Intuitive Design Architecture

    Modern delivery app design emphasizes simplicity and clarity over feature bloat. Users expect streamlined interfaces that prioritize only essential elements, reducing cognitive load and accelerating decision-making. Research indicates that 88% of users abandon apps due to poor user experience, with cluttered interfaces and confusing navigation being primary culprits. Successful delivery platforms employ minimalist design with clear menus, generous white space, and straightforward navigation patterns that guide users intuitively toward completing orders.​

    A fixed bottom navigation menu has become the standard UX pattern for delivery apps, with key actions like Home, Search, Orders, and Profile consistently positioned at the bottom where users’ thumbs naturally rest. This thumb-friendly design reduces the need for awkward hand gymnastics while maintaining quick access to core functionality. Beyond bottom navigation, successful apps organize content into clearly labeled sections and categories that prevent users from feeling lost.​

    Consistency in design elements—colors, fonts, spacing, and interactive components—creates a cohesive experience that users can navigate intuitively without requiring instruction. When design patterns remain predictable across all screens, users develop mental models of how the app works, reducing friction and enabling rapid task completion.​

    Advanced Search and Filtering Capabilities

    Food cravings are inherently specific, and delivery app users typically know exactly what they want. Advanced search functionality addresses this reality by enabling rapid discovery through multiple filtering dimensions. Users should be able to filter by cuisine type, dietary restrictions (vegan, gluten-free, halal), delivery time estimates, price range, ratings, and specific ingredients or dishes.​

    The most effective search implementations combine keyword search with contextual filtering. Instead of requiring users to scroll through hundreds of restaurants after searching, smart filtering allows users to narrow results by “Delivered in under 30 minutes,” “Top rated,” or “Currently open”. This control accelerates decision-making and improves satisfaction by helping users quickly find options matching their specific criteria.​

    Search history and saved searches further enhance efficiency for returning users. Allowing users to repeat previous searches or save custom filter combinations reduces friction on repeat visits.​

    High-Quality Visual Content and Interactive Menus

    Food is inherently visual, and delivery app design must accommodate this reality. Restaurant menus should feature high-quality food photography that makes items appear appetizing and encourages ordering. Images should load quickly despite limited bandwidth conditions, requiring optimization through compression techniques and adaptive formats like WebP and AVIF.​

    Beyond static images, modern delivery apps increasingly incorporate interactive menu elements that enhance engagement. Detailed ingredient lists, nutritional information, allergy warnings, and customization options should be readily accessible from the menu view. Some platforms are experimenting with augmented reality (AR) visualization that allows users to view meals in three-dimensional form on their devices before ordering, helping customers make informed decisions about portion sizes and presentation. This AR-enhanced menu experience reduces return rates and order dissatisfaction by eliminating surprises.​

    Visual consistency and branding through menu design is critical. Menus should use the delivery platform’s brand colors, typography, and visual hierarchy consistently across all restaurant listings.​

    Streamlined and Friction-Free Checkout

    The checkout process represents the most critical conversion point in delivery app design. Even perfectly designed app experiences fail if checkout is slow, confusing, or requires excessive data entry. Users expect to complete orders in under two minutes for straightforward transactions.​

    Best-practice checkout implementations include prefilled payment methods and delivery addresses for returning users, eliminating redundant data entry. One-touch checkout for repeat orders—”Reorder with one tap”—dramatically reduces friction for common orders. Clear payment options including digital wallets, credit cards, and emerging alternatives like buy-now-pay-later should be readily available.​

    Progress indication throughout checkout helps users understand where they are in the transaction flow and how many steps remain. Real-time validation of information prevents rejected payments or address issues at the critical checkout moment.​

    Real-Time Tracking and Transparent Delivery Status

    Delivery apps must provide comprehensive visibility into order status throughout the fulfillment journey. Users increasingly expect real-time order tracking with live maps showing driver location and estimated arrival times. Clear status updates—”Order accepted,” “Being prepared,” “On the way”—provide transparency that reduces anxiety and builds trust.​

    The most successful delivery apps incorporate interactive maps that show the driver’s real-time location, route, and remaining distance. Push notifications at key milestones (order confirmed, preparing, picked up, out for delivery) keep users informed without requiring constant app checking.​

    Estimated delivery time should be dynamically calculated and updated as conditions change, reflecting actual traffic conditions, kitchen preparation times, and driver availability. Accurate ETAs reduce false expectations and customer frustration.​

    Accessibility and Inclusive Design

    Accessibility represents not merely a compliance obligation but a competitive advantage in 2025-2026. Web Content Accessibility Guidelines (WCAG) principles—Perceivable, Operable, Understandable, and Robust (POUR)—should guide delivery app design from inception. Approximately 15-20% of the global population experiences some form of disability, representing a substantial market segment that accessible design serves effectively.​

    Key accessibility features include adequate color contrast between text and backgrounds, ensuring readability for users with low vision. Font sizes should be resizable without losing functionality, and apps should support dynamic type scaling to accommodate users with visual impairments. For users unable to see, screen reader compatibility—ensuring iOS VoiceOver and Android TalkBack properly interpret app content—is essential. Alternative text descriptions for all food images and visual elements enable screen reader users to understand menu content.​

    Beyond visual accessibility, apps should support voice input for searches and ordering, benefiting both users with motor impairments and those preferring hands-free interaction. Keyboard navigation should work seamlessly throughout the app, allowing users unable to use touchscreens to navigate effectively. For users with cognitive impairments, clear and straightforward language, logical content organization, and predictable navigation reduce cognitive load.​

    Touch targets (buttons, links, interactive elements) should be sufficiently large, typically minimum 48×48 pixels, to accommodate users with motor impairments or those using the app in mobile, low-light conditions. Interactive elements should be properly spaced to prevent accidental selection.​

    Dark Mode and Eye-Friendly Design

    Dark mode adoption has become nearly universal among modern apps, and delivery platforms should support this user preference. Beyond aesthetic appeal, dark mode provides functional benefits: reduced eye strain during evening use, improved battery life on OLED screens, and enhanced readability in low-light conditions. Approximately 50-70% of mobile users enable dark mode when available, representing a substantial portion of delivery app users ordering during evening hours.​

    Effective dark mode implementation extends beyond inverting colors. Successful implementations use softer color schemes with reduced brightness contrast, warm color palettes that are easier on the eyes during extended use, and adjusted text sizes optimized for dark backgrounds. High contrast between text and background remains essential for readability in both light and dark modes.​

    Beyond dark mode, broader eye-friendly design includes configurable text sizes, softer color schemes overall, and reduced animation brightness for users sensitive to bright stimuli.​

    Microinteractions and Motion Design

    Microinteractions—small animations and feedback loops that respond to user actions—significantly enhance perceived responsiveness and delight. When users tap an “Add to Cart” button, immediate visual feedback (button animation, cart icon update, quantity increment) confirms the action completed successfully. Without these microinteractions, apps feel unresponsive and users question whether their actions registered.​

    Smooth micro-transitions between screens, when properly executed, reduce cognitive disruption as users navigate through the app. Motion should guide attention toward important information without creating distraction. Haptic feedback—subtle vibrations confirming taps, form submission, or order completion—adds tactile confirmation that enhances perceived polish.​

    However, motion design must be performant. Excessive animations degrade app responsiveness and drain battery, particularly on lower-end devices. Modern best practices implement simplified, optimized animations that enhance rather than hinder user experience.​

    Voice and Gesture-Based Navigation

    Gesture-based navigation is increasingly replacing button-based navigation to maximize screen space and create more intuitive interactions. Swiping, pinching, and dragging replace traditional menu buttons, decluttering interfaces and making interactions feel more natural on touch-first devices. The swipe-to-go-back gesture, implemented consistently across the app, accelerates navigation and reduces reliance on visible back buttons.​

    Voice navigation and search capabilities enable hands-free interaction essential for accessibility and multitasking scenarios. Users should be able to voice-search for specific restaurants or dishes, place orders via voice commands, and navigate the app using voice control.​

    Performance Optimization and Lightning-Fast Loading

    User tolerance for app slowness has become increasingly low. Apps must launch within 2-3 seconds and achieve 60 frames per second during interactions to feel responsive. Performance optimization requires systematic technical and design approaches working in concert.​

    Technical strategies include lazy loading (loading only essential content at startup, deferring secondary features), aggressive image optimization through compression techniques and adaptive formats, and intelligent caching of frequently accessed data. Apps should minimize network requests through bundled data transmission and local caching of restaurant menus, pricing, and user preferences. Off-screen content like restaurant menus below the current viewport should load progressively rather than blocking initial page rendering.​

    Design-optimized performance involves minimalist interfaces that reduce the visual complexity the rendering engine must process. Reducing the number of animations, limiting graphic density, and simplifying visual elements all improve performance. Mobile apps should undergo performance audits identifying bottlenecks and optimizing the slowest 10% of user interactions that disproportionately impact perceived performance.​

    Different device capabilities demand adaptive design. Budget phones with limited RAM and processing power should receive optimized experiences with simplified animations and reduced image quality, while flagship devices can deliver richer visuals. Testing on real devices of various capabilities ensures consistent responsiveness.​

    Multi-Platform Synchronization and Cross-Device Continuity

    Users increasingly expect seamless continuity across devices. A customer might browse restaurants on their smartwatch, begin ordering on their tablet, and complete checkout on their smartphone, expecting the experience to flow naturally across devices. Modern delivery platforms synchronize order information, saved preferences, and cart contents across smartphones, tablets, smartwatches, and even smart TVs.​

    Cross-device orchestration ensures that initiating an order on one device and continuing on another maintains context without requiring re-entry of information or restarting workflows. This seamless experience represents a significant competitive advantage in markets where multi-device ownership is common.​

    Contextual UI Adaptation and Smart Defaults

    Smart apps anticipate user needs based on context like time of day, location, and historical behavior. During lunch hours, apps might surface restaurants popular for quick lunch orders. During evening hours, dinner-focused restaurants receive prominence. Apps aware that a user has recently moved to a new location automatically refresh restaurant recommendations based on the new area.​

    Real-time context awareness extends to network conditions. On slow connections, apps should automatically reduce image quality and prioritize essential information transmission over rich media. Apps running on battery-saving modes should optimize resource consumption.​

    Social Integration and Community Features

    Modern delivery apps increasingly incorporate social elements enabling users to share meal photos, write detailed reviews, and potentially order directly through social platforms. These features expand app reach through word-of-mouth marketing while enhancing user engagement through community interaction.​

    User-generated content—reviews, ratings, photos from actual customers—builds trust more effectively than professional marketing. Influencer integration tools and mechanisms for easy social sharing amplify visibility and user acquisition.​

    Sustainable and Eco-Conscious Design

    As environmental consciousness rises among consumers, delivery platforms increasingly highlight sustainable options. Apps should clearly identify eco-friendly packaging choices, display carbon impact of delivery options (faster delivery typically requires more fuel), and highlight restaurants committed to sustainability. Gamification of sustainable choices—rewards for selecting eco-friendly packaging or carbon-neutral delivery—encourages adoption.​

    Implementation Priorities for Platform Developers

    Delivery platforms should prioritize implementations strategically based on their current capabilities and competitive positioning. Essential foundations include minimalist navigation, high-quality food imagery, seamless checkout, and real-time tracking—the absolute requirements of modern delivery apps. Secondary implementations like personalized AI recommendations, advanced accessibility features, and multi-device synchronization should follow core functionality.​

    The competitive landscape demands continuous evolution. Platforms implementing personalization, accessibility, and performance optimization consistently outperform competitors relying on outdated design patterns. The most successful delivery apps in 2026 will be those that seamlessly balance aesthetic appeal with functional usability—delivering experiences that feel intuitively designed for each individual user while maintaining the technical performance standards users have come to expect.​

  • The Environmental Impact of Ride-Sharing Services

    The Environmental Impact of Ride-Sharing Services

    Ride-sharing services have fundamentally transformed urban transportation, but their environmental consequences are far more complex and concerning than initially anticipated. Rather than reducing emissions, current ride-hailing operations often increase pollution through mechanisms that extend beyond simple vehicle operation.

    The Emissions Paradox: More Pollution Than Alternatives

    The most troubling finding from recent environmental research reveals that ride-hailing trips generate substantially more climate pollution than the transportation alternatives they displace. Non-pooled ride-hailing trips result in an estimated 69% more climate pollution on average than the modes people would have otherwise used. This represents a fundamental failure of the industry to deliver on its environmental promise. When measured against private car trips, a solo ride-hailing trip emits approximately 47% more greenhouse gas emissions than a private vehicle of average fuel efficiency.​

    The severity of this impact becomes apparent when considering what transportation modes ride-hailing actually replaces. In cities with robust public transportation systems, ride-hailing predominantly displaces walking, biking, and transit usage rather than substituting for personal vehicle ownership. Since public transit, cycling, and walking produce zero or near-zero emissions, replacing these modes with vehicle-based ride-hailing creates net increases in total urban emissions. In regions with lower public transit availability, ride-hailing’s impact is more neutral, as it more directly substitutes for personal vehicle trips.​

    The Deadheading Problem: Empty Miles and Wasted Emissions

    The primary driver of ride-hailing’s environmental inefficiency is “deadheading”—the distance traveled without passengers. Ride-hailing drivers spend approximately 42% of their service time either waiting for rides or traveling to pick up passengers. Across all ride-hailing vehicles, between 35% and 50% of total distance traveled is deadheading, with some studies estimating that in specific cities, empty running comprises up to 40-81% of total vehicle miles traveled.​

    This empty running substantially increases emissions because vehicles consume fuel and produce pollution regardless of occupancy. The deadheading phenomenon alone accounts for approximately 32% of lifecycle emissions from ride-hailing services. Unlike a personal car trip where the owner absorbs all emissions for one passenger, or public transit where emissions are distributed across 40-60 passengers, ride-hailing vehicles generate emissions during both paid and unpaid mileage, dramatically reducing their per-passenger efficiency.​

    Research from specific cities illustrates the magnitude of this impact. In San Francisco, where ride-hailing has achieved unusually high market penetration, Uber and Lyft vehicles represent approximately 13.4% of all vehicle miles traveled despite accounting for a much smaller share of trips. This disparity directly results from excessive deadheading as drivers search for the next fare. San Francisco experienced a 2.21% increase in greenhouse gas emissions and a 1.38% increase in vehicle miles traveled directly attributable to ride-hailing introduction.​

    Traffic Congestion and Induced Demand

    Ride-hailing services paradoxically increase total vehicle miles traveled despite promising ride-sharing efficiency. Studies indicate that ride-hailing adds approximately 2.6 additional miles of vehicle travel for each mile of personal driving it replaces. This occurs through multiple mechanisms: drivers deadheading between passengers, riders taking trips they wouldn’t otherwise make due to convenience, and vehicles cruising for passengers while the app is active.​

    This induced demand creates substantial environmental consequences through congestion. Additional vehicle traffic increases fuel consumption and emissions, air pollution, and infrastructure strain. The environmental impact extends beyond direct emissions, as congestion delays increase overall journey times, meaning vehicles consume fuel for extended periods. In major metropolitan areas, ride-hailing now represents 1-3% of total vehicle miles traveled overall, but in dense urban centers like New York City, this figure reaches up to 50% of traffic during peak hours.​

    Modal Displacement: The Transit Cannibalization Problem

    Perhaps the most environmentally damaging aspect of ride-hailing is its systematic displacement of sustainable transportation modes. Research across 42 U.S. metropolitan areas demonstrates that when Uber enters a market, public transit ridership declines significantly. This represents a critical environmental failure because public transit produces approximately one-third the emissions of ride-hailing services per passenger mile.​

    The modal displacement problem is particularly acute in cities with strong transit systems. In cities where most residents use public transportation, walking, or cycling, ride-hailing shifts the baseline toward less sustainable transportation. Ride-hailing also reduces cycling and walking for first-mile/last-mile connections, potentially discouraging public transit usage altogether when it becomes unreliable due to reduced demand. This creates a self-reinforcing cycle where ride-hailing reduces public transit ridership, leading transit agencies to reduce service, making transit less attractive and pushing more users toward ride-hailing.​

    Electric Vehicles: Limited Solution Without Structural Changes

    The ride-hailing industry has begun investing in electric vehicle adoption as a primary environmental strategy. Uber has committed to net-zero emissions by 2040, with goals for 50% of kilometers in seven major European cities to be in electric vehicles by 2025. Lyft and Go-Jek plan completely emissions-free operations by 2030. California’s Clean Miles Standard requires 90% of ride-hailing miles to occur in zero-emission vehicles by 2030.​

    While electric vehicle adoption reduces tailpipe emissions, it addresses only one component of ride-hailing’s environmental problem. Electrification alone reduces emissions by approximately 84%, but this still leaves significant impacts from deadheading and induced demand. A pooled ride-hailing trip in an electric vehicle emits nearly the same amount per passenger as a private car ride, far higher than public transit. Additionally, electric vehicle production carries substantial upstream emissions, and electrification does nothing to address the fundamental issue of additional vehicle miles traveled and traffic congestion.​

    Research indicates that even with complete electrification and 50% pooling rates, ride-hailing would still produce 52% higher emissions than the transportation modes it displaces. Without addressing modal displacement and induced demand, electrification represents a partial rather than comprehensive environmental solution.​

    The Pooling Opportunity: Underutilized and Insufficient

    Pooled ride options like UberX Share and Lyft Line offer substantially lower emissions per passenger. A pooled ride-hailing trip generates approximately 79% lower emissions than non-pooled rides. However, pooling remains dramatically underutilized—only 15% of all U.S. ride-hailing trips are pooled. This low adoption reflects consumer preferences for privacy and convenience over environmental considerations, creating a fundamental market failure where individual incentives diverge from environmental benefits.​

    Even if pooling were maximized, it would not fully resolve environmental concerns. Pooled rides still increase overall vehicle miles traveled through induced demand and deadheading, and they continue displacing public transit usage. A pooled ride-hailing trip remains substantially less efficient than public transit, which operates with fixed routes and schedules optimized for passenger volume.​

    Market Scale and Geographic Variation

    The overall national environmental impact of ride-hailing has remained relatively modest to date—approximately 0.14% increase in CO2 emissions and 0.08% increase in vehicle miles traveled—because ride-hailing currently represents less than 1% of all trips nationally. However, this aggregate figure masks dramatic variation across cities and regions. Dense urban areas with strong public transit systems experience disproportionately negative environmental impacts, while car-dependent regions see negligible or slightly positive effects.​

    This geographic variation has critical policy implications. Cities with the most developed alternatives to driving—precisely the areas with the strongest climate commitments—are experiencing the worst environmental impacts from ride-hailing. Conversely, ride-hailing’s impact in sprawling, car-dependent areas is minimal because it more directly substitutes for personal vehicles rather than displacing transit.​

    Policy Solutions and Strategic Interventions

    Addressing ride-hailing’s environmental impacts requires multifaceted policy approaches beyond simple vehicle electrification. Cities are implementing several complementary strategies:

    Regulatory caps on vehicle supply: Some jurisdictions have implemented or proposed caps on the number of ride-hailing vehicles allowed to operate, directly limiting induced demand.​

    Pooling mandates: Several cities have proposed requirements that ride-hailing companies increase the percentage of pooled rides through incentives, penalties, or service restrictions.​

    Integration with transit: Cities are working to position ride-hailing as a first-mile/last-mile connector to public transit rather than a substitute, ensuring it complements rather than cannibalizes transit usage.​

    Congestion and emissions pricing: London and other cities charge ride-hailing vehicles higher congestion pricing to internalize environmental costs.​

    Zero-emission requirements: Multiple cities and regions have implemented timelines requiring ride-hailing fleets to transition to zero-emission vehicles, with the strictest requirements in cities with the highest environmental concerns.​

    The Optimistic Scenario: Structural Requirements for Positive Outcomes

    Research indicates that ride-hailing could theoretically contribute to climate change mitigation if three conditions are met simultaneously: complete transition to zero-emission vehicles, conversion of at least 50% of trips to pooled rides, and deliberate policy integration with public transit to prevent modal displacement. However, achieving all three conditions simultaneously remains difficult. Market incentives push toward non-pooled premium services that generate higher driver earnings and company revenues. Consumers prefer the convenience and privacy of solo rides. And cities struggle to enforce modal integration while private companies optimize for profit maximization.​

    Comparative Environmental Context

    The transportation sector contributes approximately 23% of global CO₂ emissions, with road transportation comprising the largest portion. Within this context, ride-hailing services have become increasingly significant. The industry’s rapid growth—from Uber’s first ride in 2010 to over 10 billion Uber trips and 1 billion Lyft trips accumulated globally by 2018—demonstrates that ride-hailing represents a substantial and growing share of urban mobility.​

    Ride-hailing’s environmental impact ultimately reflects a fundamental tension in transportation policy: services that maximize individual convenience often minimize environmental benefits. The platforms excel at providing flexible, on-demand transportation tailored to individual preferences. These characteristics make them attractive to consumers but also make them inherently less efficient than the large-scale, fixed-route systems that optimize environmental performance. Until policy frameworks more directly reward pooling, transit integration, and mode shifts toward sustainable alternatives, ride-hailing will continue to increase transportation emissions despite technological improvements in vehicle efficiency.

  • Ride-Hailing vs Traditional Taxis: Pros and Cons

    Ride-Hailing vs Traditional Taxis: Pros and Cons

    The competition between ride-hailing services and traditional taxis has fundamentally reshaped urban transportation. Each model offers distinct advantages and disadvantages that vary significantly based on user priorities, location, and circumstances.

    For Passengers: Cost Considerations

    The pricing comparison between ride-hailing and taxis is nuanced and depends heavily on trip length. For shorter urban trips under $35, traditional taxis typically offer better value, accounting for approximately 94% of taxi fares. In major cities like New York, London, and San Francisco, flagging down a yellow cab for brief journeys is generally more economical than using Uber or Lyft. However, ride-hailing services prove more cost-effective for longer trips, airport runs (except major hub airports), and in suburban or regional areas where traditional taxi infrastructure is limited. Businesses find that Uber is approximately 40% less expensive than traditional taxi services, with employers potentially saving up to $1,000 per employee annually.​

    Upfront pricing transparency represents a significant consumer advantage for ride-hailing. Apps provide fare estimates before booking, eliminating the uncertainty of metered taxi rates that can fluctuate based on traffic, driver routing choices, or unfamiliar surcharge policies. Pooled options like UberX Share and Lyft Line further reduce costs for price-conscious riders willing to share vehicles.​

    Convenience and User Experience

    Ride-hailing applications excel in convenience and accessibility. Users can request rides from anywhere using their smartphones, track driver locations in real time, and communicate directly with drivers through the app. This eliminates the need to stand on streets searching for available taxis or make phone calls to dispatch services. Payment processing through apps is seamless and cashless, with integrated tipping options, removing the awkward payment transactions and cash handling required with traditional cabs.​

    Traditional taxis, by contrast, remain limited to street hailing or phone dispatching, which creates longer wait times and less certainty about driver availability and arrival times. Taxi drivers rely on dispatchers rather than real-time algorithmic matching, making the service less predictable. However, taxis can be hailed immediately in high-traffic urban areas where they concentrate, whereas ride-hailing services require app access and may face driver shortages during peak demand.​

    Safety and Accountability

    Both systems incorporate safety mechanisms, though they operate differently. Ride-hailing platforms employ driver background checks, vehicle maintenance reporting, and mandatory cleanliness standards. The driver rating system creates accountability, as drivers with low ratings face deactivation. Passengers can see driver photos, vehicle information, and real-time GPS tracking, providing enhanced security awareness. Passengers can also share their trip details with emergency contacts through the app.​

    Traditional taxis have historically been regulated with established safety protocols, licensed medallion systems in major cities, and consistent driver vetting. However, taxis lack the digital accountability mechanisms that ride-hailing apps provide. Some passengers perceive traditional cabs as safer due to their visible licensing and regulatory oversight, while others prefer the transparency and tracking features of ride-hailing apps.​

    Environmental and Traffic Impact

    This represents a significant drawback of ride-hailing services. While individual ride-sharing trips produce fewer emissions than private car ownership, the aggregate impact has been negative for urban transportation systems. Ride-hailing services have increased vehicle miles traveled (VMT) by 160% more than traditional taxis in major cities. Non-pooled ride-hailing trips generate approximately 69% more emissions than the trips they displace, primarily due to “deadheading”—vehicles traveling without passengers between rides. Studies indicate that approximately 40% of ride-hailing vehicle miles are traveled without passengers.​

    Ride-hailing also competes with lower-carbon transportation modes. Rather than replacing personal car ownership, ride-hailing has displaced transit ridership and bicycle use, resulting in net increases in traffic congestion and emissions in many cities. In urban areas, ride-hailing adds approximately 2.6 miles of additional travel for each mile of personal driving it replaces. Traditional taxis, while not perfect, have historically operated with better vehicle utilization and less deadheading than modern ride-hailing platforms.​

    Driver Economics and Working Conditions

    The driver experience differs markedly between platforms. Uber drivers earn an average of $19.73 per hour, though this drops to approximately $13.47 per hour after accounting for vehicle expenses. Lyft drivers average $17.49 per hour gross, or approximately $11.55 after expenses. Both platforms take significant commissions—Uber approximately 25% and Lyft around 20%. Drivers must also invest in specialized rideshare insurance, which costs substantially more than personal auto insurance, and they receive no traditional benefits like health insurance, paid leave, or retirement contributions.​

    Traditional taxi drivers present a more complex picture. In regulated markets with medallion systems, established taxi drivers can earn more per hour than ride-hailing drivers. According to New York City data, taxi drivers earned an average of $5,844 monthly including tips, compared to $5,046 for Uber and Lyft drivers. However, taxi drivers face significant fixed costs—daily vehicle leases ($120+ for 12-hour shifts) and maintenance responsibilities—which reduce net income. For drivers working fewer hours, ride-hailing often provides greater flexibility and better net returns. In cities without medallion systems, taxi driving typically offers better earnings potential than ride-hailing.​

    Surge Pricing and Peak Demand Challenges

    Ride-hailing platforms employ surge or “Prime Time” pricing during high-demand periods, which can dramatically increase fares. While this incentivizes drivers to work during busy periods, passengers face dramatically higher costs exactly when they need transportation most. During holidays, nights, or weather events, surge pricing can make ride-hailing significantly more expensive than alternatives. Traditional taxis generally maintain consistent pricing regardless of demand, though hailing becomes more difficult during peak periods.​

    Market Impact and Industry Disruption

    Ride-hailing services have substantially reduced demand for traditional taxis. Research indicates that ride-hailing services reduce traditional taxi usage by an average of 25.46%, with impacts varying by region. This disruption has been particularly acute in major cities where Uber ridership surpassed taxi usage by 2017 in New York City. Taxi companies have struggled with profitability, declining vehicle fleets, and reduced customer loyalty as consumers migrate to app-based services.​

    Traditional taxi companies have been slow to adopt technology compared to ride-hailing platforms. Many still operate on cash-only payments and lack real-time driver tracking or digital booking systems. However, some established taxi services are beginning to develop apps and modernize their operations to remain competitive.​

    Regulatory Environment

    The regulatory landscape continues evolving. Multiple cities have implemented commission caps on delivery fees ranging from 15% to 20%, with some countries implementing comprehensive new standards. San Francisco, New York City, and other major jurisdictions have introduced price controls and driver protections. These regulatory changes suggest a shifting balance where ride-hailing may face increased operational constraints, potentially narrowing the cost advantage over traditional taxis.​

    Traditional taxis operate under established regulatory frameworks with medallion systems in many cities, creating barriers to entry but also providing stability and consumer protection standards. Governments increasingly view ride-hailing regulation as essential for consumer protection, environmental sustainability, and driver welfare.

    Insurance and Liability Gaps

    Ride-hailing drivers operate in a coverage gap where personal auto insurance typically excludes commercial ridesharing activities, while rideshare company insurance provides limited coverage during waiting periods (app on, no passenger). This creates potential financial exposure during certain operational phases. Passengers enjoy comprehensive coverage through rideshare company insurance once a ride is accepted, though gaps exist in certain scenarios.​

    Traditional taxi drivers and passengers typically have clearer insurance frameworks established through regulatory requirements, though the specific coverage varies by jurisdiction.

    Choosing Between Services

    Ride-hailing is advantageous for: longer trips over $35, airport transportation in most cities, suburban and regional travel, passengers valuing convenience and real-time tracking, those seeking cashless transactions, and travelers prioritizing upfront pricing transparency.​

    Traditional taxis are advantageous for: short urban trips under $35, passengers in dense city centers with high taxi availability, those avoiding surge pricing concerns, travelers without smartphone access, passengers prioritizing consistent pricing, and situations where immediate street hailing is most convenient.​

    The long-term trajectory suggests continued regulatory intervention to balance the operational efficiency of ride-hailing platforms with environmental sustainability, driver protections, and consumer fairness that characterized traditional taxi systems.

  • How On-Demand Delivery Apps Are Changing Small Business Sales

    How On-Demand Delivery Apps Are Changing Small Business Sales

    On-demand delivery apps have fundamentally transformed the sales landscape for small businesses, creating both unprecedented opportunities and significant challenges. The impact varies dramatically depending on how businesses leverage these platforms strategically.

    The Scale of the Digital Shift

    The market has undergone explosive growth that directly affects small business operations. The global online food delivery market reached an estimated $288.84 billion in 2024 and is projected to reach $505.50 billion by 2030. Uber Eats alone generated $13.7 billion in revenue in 2024, marking a 13.2% year-on-year increase. This expansion reflects a profound change in consumer behavior, with delivery sales growing at more than three times the rate of on-premises revenue. For small businesses, this shift has made delivery services virtually essential rather than optional.​

    Expanded Market Reach and Customer Acquisition

    The most compelling advantage of on-demand delivery apps for small businesses is access to massive customer bases. These platforms provide exposure to millions of users who might never discover a restaurant or retail business otherwise. Third-party delivery services have been found to raise restaurant sales volume by 10 to 20%, and 60% of restaurant operators report that offering delivery has generated incremental sales. For businesses opening new locations or launching ghost kitchens, these platforms provide immediate access to market without requiring independent customer acquisition investments.​

    The visibility benefit extends beyond geography. Delivery apps function as built-in marketing channels, eliminating the need for businesses to spend heavily on digital advertising to reach local customers. This is particularly valuable for younger and smaller independent restaurants that lack established brand recognition.​

    The Commission Fee Challenge

    The hidden cost structure of delivery platforms represents the most contentious aspect of this transformation. Commission fees range from 12% to 35% per order, with platforms like Uber Eats charging up to 35% plus additional fees. Most restaurants operate on profit margins of 50% or less, meaning that a 20-30% commission significantly reduces earnings on each delivery order. Small business owners report paying approximately 31% in fees for Uber Eats and 22% for Grubhub and DoorDash, despite recognizing the services’ value for business growth.​

    This fee structure creates a paradox: while delivery orders increase sales volume, the financial benefits are often outweighed by platform charges. For sectors like pizza restaurants that historically relied on delivery before apps existed, the impact has been particularly acute, with some pizza restaurants counting on deliveries for as much as 75% of their business.​

    Loss of Customer Control and Relationships

    A critical but often underestimated consequence is the loss of direct customer relationships. Delivery apps retain all customer data and prevent direct marketing opportunities that could build long-term loyalty. When customers order through these platforms, the business never learns their contact information for future marketing, email campaigns, or loyalty programs. The app controls the customer relationship entirely, reducing opportunities for repeat business through direct channels. Additionally, customers who use these platforms typically shop for deals rather than specific restaurants, leading to low brand loyalty.​

    Operational and Competitive Pressures

    Delivery platforms have fundamentally restructured how small businesses operate. Restaurants must redesign physical spaces to accommodate delivery driver pickup areas, invest in tablet systems for order management, and potentially face penalties if they don’t maintain adequate inventory for delivery orders. Many establishments report losing control over pricing, as apps adjust menu prices without consulting restaurants, directly impacting customer relationships and brand positioning.​

    The competitive dynamic has shifted dramatically. When delivery platforms enter a market, they intensify competition at scale, making survival harder for smaller establishments. Younger and smaller independent restaurants struggle more, as familiarity and consumer trust play crucial roles in delivery platform visibility. Some platforms employ pay-to-play visibility models, where only restaurants paying premium advertising fees receive prime placement.​

    Emerging Solutions and Strategic Alternatives

    Recognizing these challenges, small businesses increasingly adopt hybrid strategies. Building branded online ordering systems allows restaurants to keep 100% of revenue from direct orders, own customer data, and maintain control over pricing and customer experience. Many successful restaurants now use delivery apps primarily as a customer acquisition channel—accepting lower margins on app orders to capture first-time customers—then converting those customers to direct ordering through loyalty programs, email marketing, and exclusive promotions.​

    The emergence of ghost kitchens (cloud kitchens or dark kitchens) represents another transformative trend. These delivery-only facilities eliminate the overhead of traditional dining spaces, reducing rent, utilities, and front-of-house staffing costs. The ghost kitchen market was valued at over $40 billion in 2022 and is expected to continue growing exponentially. This model allows small operators and established chains to test new concepts with minimal investment while maintaining higher profit margins than traditional restaurants using third-party delivery.​

    Regulatory Changes and Future Outlook

    The regulatory landscape is shifting in response to concerns about excessive fees. Several major U.S. cities, including San Francisco and New York City, have capped delivery app commissions at 15% for delivery services, with additional limitations on advertising fees. Multiple countries are implementing new standards: China recently introduced national standards to curb excessive platform fees and aggressive sales tactics, while lawmakers in South Korea are pushing fee caps with penalties up to 10% of annual sales for violations.​

    These regulatory changes signal a structural shift in the industry. Delivery platforms are increasingly investing in value-added services for restaurants rather than relying solely on high commission rates. This trend toward lower-fee service models may improve profitability for small businesses using these platforms.​

    Strategic Implications for Small Business

    Small business owners should recognize that on-demand delivery apps represent a double-edged sword. The platforms offer unmatched customer reach and marketing visibility, making them essential for new customer acquisition. However, relying heavily on these platforms without developing direct customer channels can erode profitability and business autonomy. The most successful small businesses increasingly employ a balanced approach: using delivery apps strategically as customer acquisition tools while systematically converting those customers to direct ordering channels where margins are significantly higher. Investing in branded online ordering systems, loyalty programs, and customer data ownership creates sustainable competitive advantages that reduce dependence on platform commissions and rebuild the direct customer relationships that form the foundation of long-term business success.